There have been a number of recent articles commenting on the lower volumes of USD Interest Rate Swaps, for example SEFVolumes died last week and US IRS Volumes-SEF MAT Cliff or Steady Decline.
So now that 3 weeks have passed I decided to update my article SEF MAT Week One, What Does the Data Show.
What Can We See?
Using SDRView Researcher to look at weekly volumes for all USD Interest Rate Swaps in the five week period starting February 3, 2014.
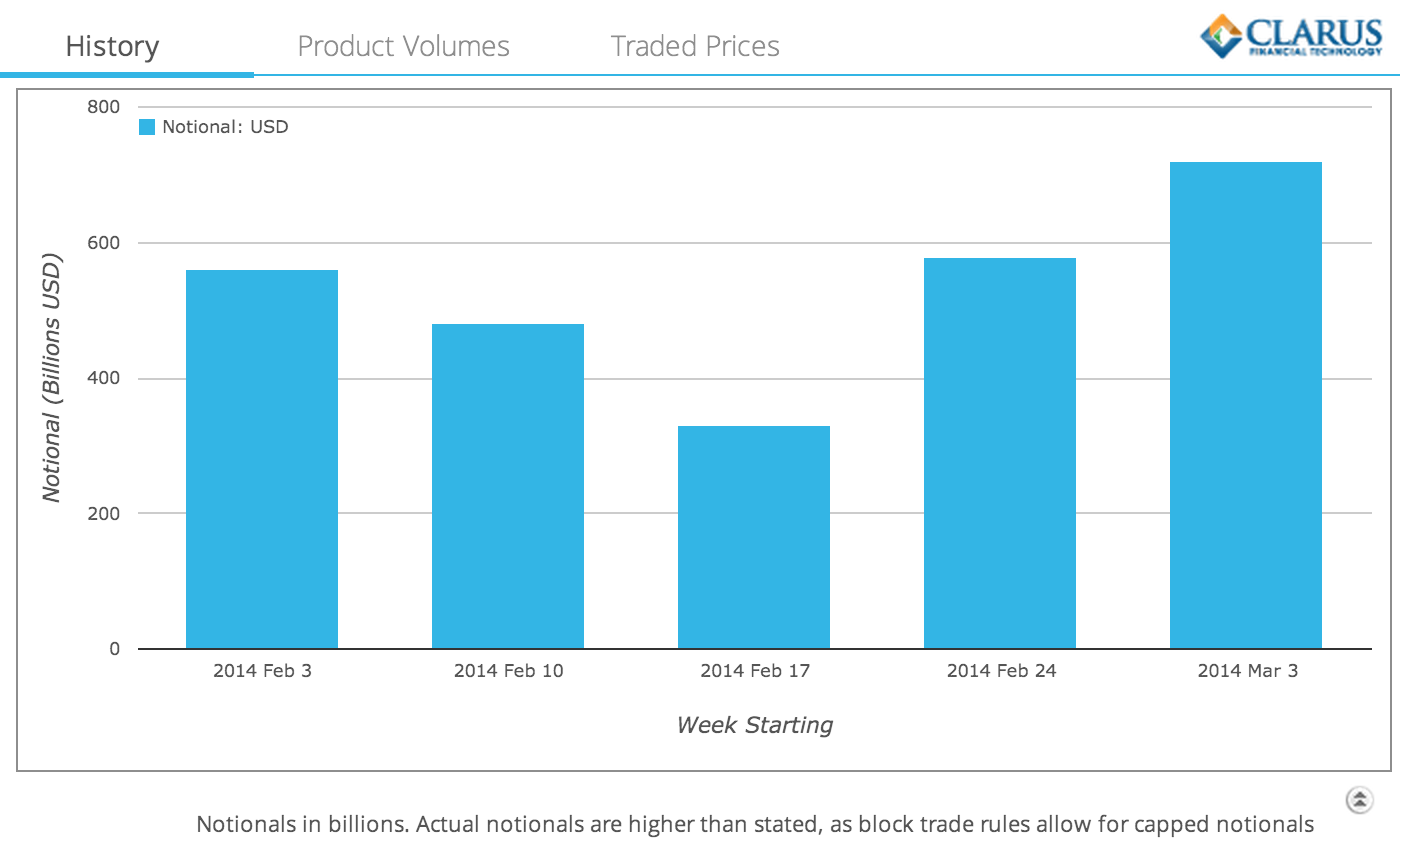
We can see that:
- There was indeed a pronounced dip leading up to Feb 17 (IRS MAT date)
- This was exaggerated by the US public holiday on Feb 17
- Week 1, Week 2 and Week 3 show significant week on week increases
- From $330 billion, to $580 billion to $720 billion
- In-fact Week 3 (Mar 3-7) has the highest volume of any week in 2014
Which all suggests that we are over the hump and those drop in volume stories should be an artefact of the past.
On SEF vs Off SEF
For Week 3, charts of On SEF vs Off SEF Volumes for all USD IRS.
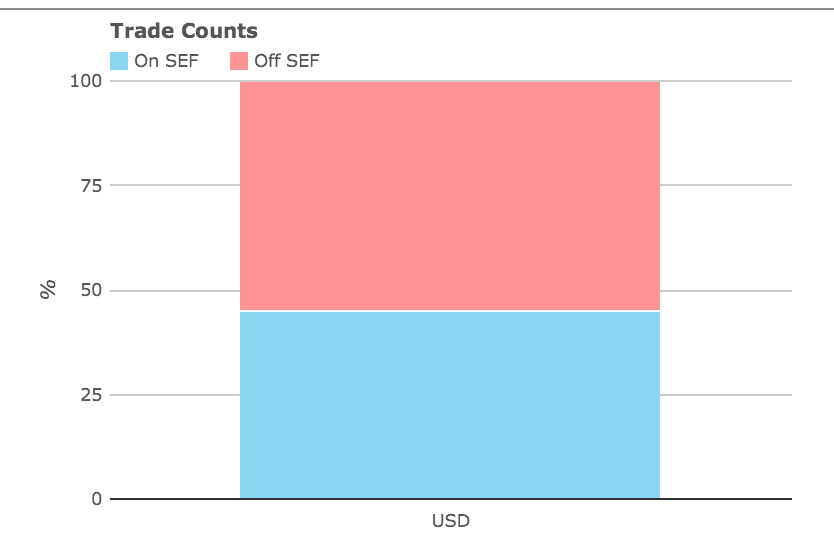
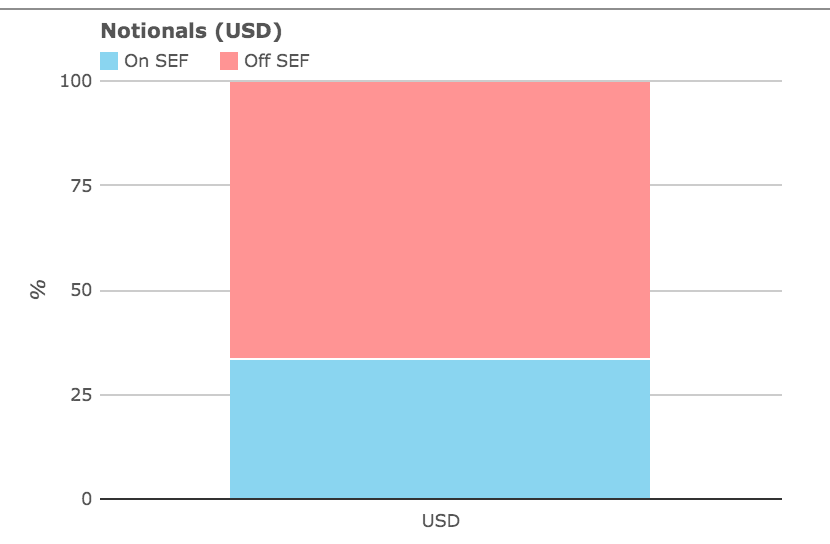
From which we see that 45% in trade count and 33% in gross notional is On SEF.
Not bad you would say, given that only spot starting par swaps are MAT with exemptions for packages (e.g. spreads to treasuries)
Lets Contrast this with Cleared vs Uncleared.
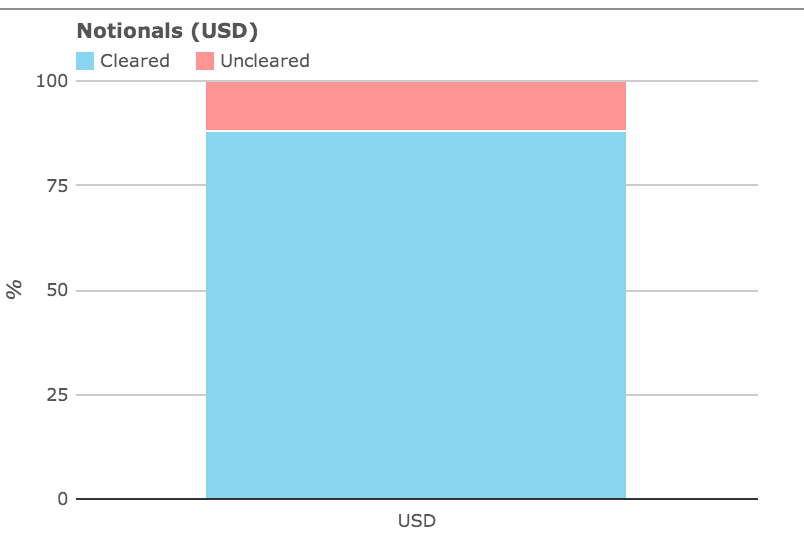
Which shows 88% are Cleared.
So 33% to 88%, quite some way to go.
Granted mandatory clearing has been in-force much longer (9M to 1Y).
However it does depend on the goal.
Is it to move as much Swap volume as possible to On SEF?
Including all the forwards, broken dates and non-standard deals?
Or is it to move the liquid flow products which are suitable for CLOBs?
Either way 33% is far from a majority of the volume.
So we expect to see more MAT determinations.
After-all if CCPs can risk manage all those Swaps, surely SEFs can make markets in them.
Vanilla Spot Starting Par Swaps
Lets now use SDRView Professional to look at Week3 volumes and just vanilla spot starting par swaps.
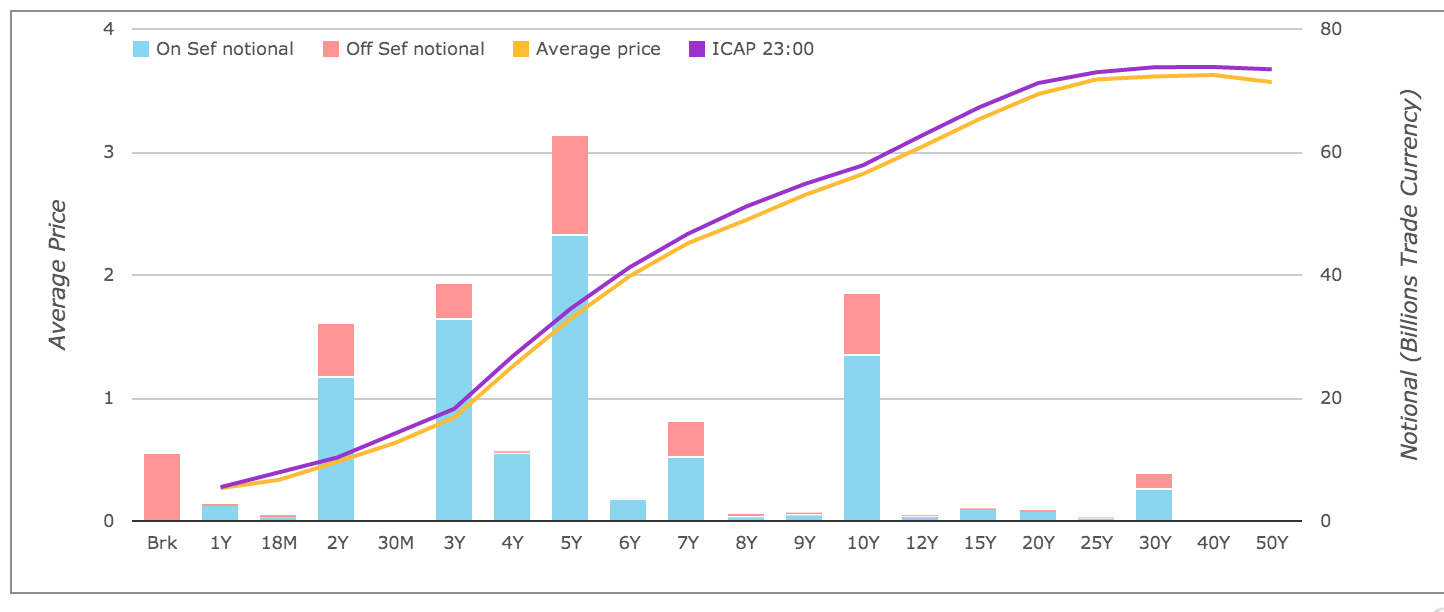
Using this and the table of results (not shown), we can see that:
- For On SEF and Off SEF, there are 3,124 trades of > $233 billion gross notional
- This represents 33% of all USD IRS (in notional terms)
- So one third of all USD IRS volume is spot starting swaps (including broken dates and non mat tenors)
- For On SEF there are 2,358 trades of > $170 billion notional
- Which means ON SEF is 75% in trade terms and 73% in notional terms
- The Package exemption (to May-15) represents the majority of the 25% Off SEF
- Though Broken Dates of $11 billion or 5% are also significant
Given that 33% of USD IRS is Vanilla Spot Starting, it does suggest that after the Package exemption, the next goal for regulators and the industry will be to look at the other 66% in detail. All those Forwards, IMMs, Libor Spread trades.
SEF Volumes
Using SEFView we can also look at the volumes reported by the SEF themselves.
First the volumes for Week 1 to Week 3, USD IRS only.
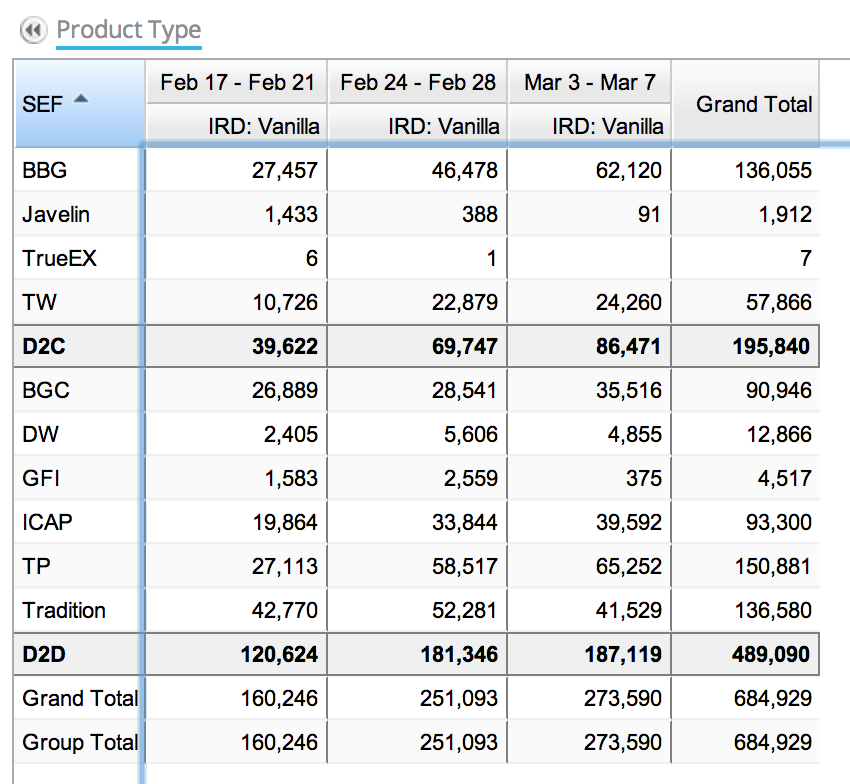
From which we see that Week 3 has $274 billion notional reported by the SEFs.
How do we explain the SDR Week3 notional of $170 billion?
Well there are two main reasons for the difference.
- SDR trade notionals are capped (so 5Y is $240 million max).
- SEFView figures include IMM and Fwds (currently no easy way to exclude these).
In-fact the sum of Capped notional is $33 billion out of the $170 billion.
If we follow our rule of thumb and double this and add the resulting $66 billion to $170 billion, we get $236 billion.
Not far from the $274 billion, given that Forwards and IMMs will also traded On SEF in decent volume.
SEF Market Share.
Lets now look at the same SEFView table but by percent of total.
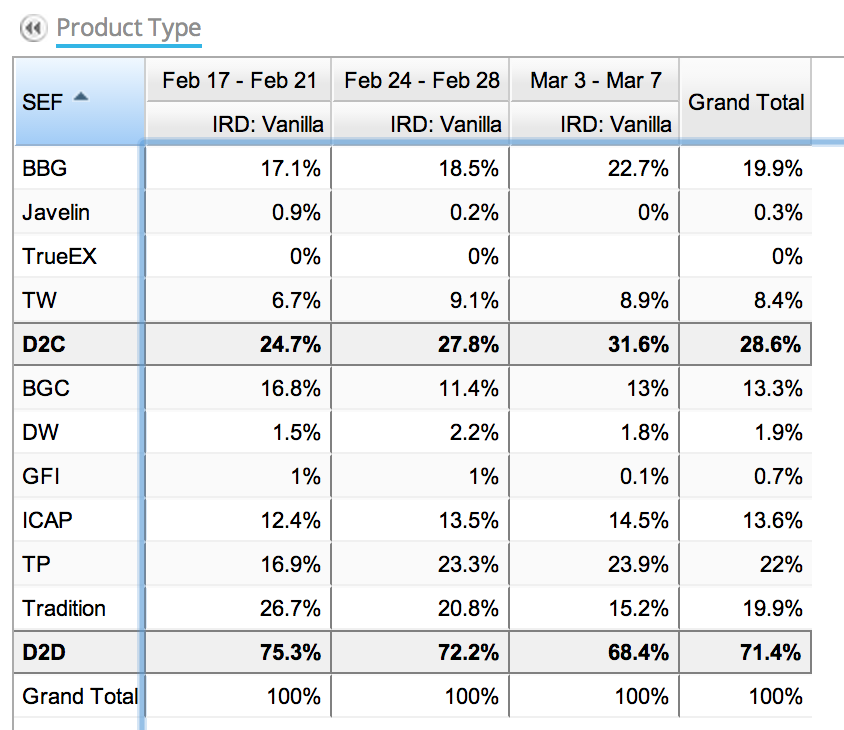
From which we can observe:
- There are 10 SEFs reporting some volume in USD IRS
- Of these 3 currently are each <1% – Javelin, TrueEx, GFI
- Which leaves 7 with decent volumes
- Of these
- Tullet leads with 22%
- Bloomberg and Tradition follow with 19.9% each
- Then ICAP and BGC with 13.5% and 13.3%
- Then TW with 8.4%
- There are some changes in share over the 3 week period
- With BBG, TW, DW and Tullets gaining over the others
Remember we do not currently DV01 weight the volumes.
We do plan to do this in the near future, as it better reflects how much risk is being transacted on each SEF.
Is there enough business for 10 SEFs in USD IRS?
Definitely not.
Is there enough business for 7 SEFs?
Probably not.
Is there enough business for 5 SEFs?
Perhaps.
Is there enough business for 3 SEFs?
Most definitely.
We live in interesting times.