
This blog looks at the most active issuer names traded in September 2026 on US-reported single-name credit default swaps (CDS). This follows the March 2026 edition in the series – aligned to the conventional CDS volume peaks near March and September IMM dates.
Key takeaways
- US-reported corporate single-name trade count rankings showed marked rises for US big tech and European financial names. These led overall activity to rise 34% HoH and 62% YoY. By comparison, global cleared corporate trade counts retreated 12% HoH but rose 9.3% YoY.
- US-reported sovereigns trade count retreated 20% HoH and 4.4% YoY, while global cleared sovereigns retreated 37% HoH and 22% YoY.
- These figures imply that US parties were more active than non-US parties in single-name CDS.
Data coverage
I use the “Most Active” tab from SBSDRView to aggregate by issuer name the periodic US-reported CDS activity. I prefer to use the trade count metric, thereby avoiding the distortion of aggregated notional amounts by the SDR-reporting trade caps of $5 million, which impacts about three quarters of the trades. We limit to USD, EUR and JPY which are 99.98% of the trade count.
As context, I include overall single-name trade counts – both US-reported (from SBSDRView) and global cleared (from CCPView).
Sovereigns
We start with USD sovereign name single-name CDS.
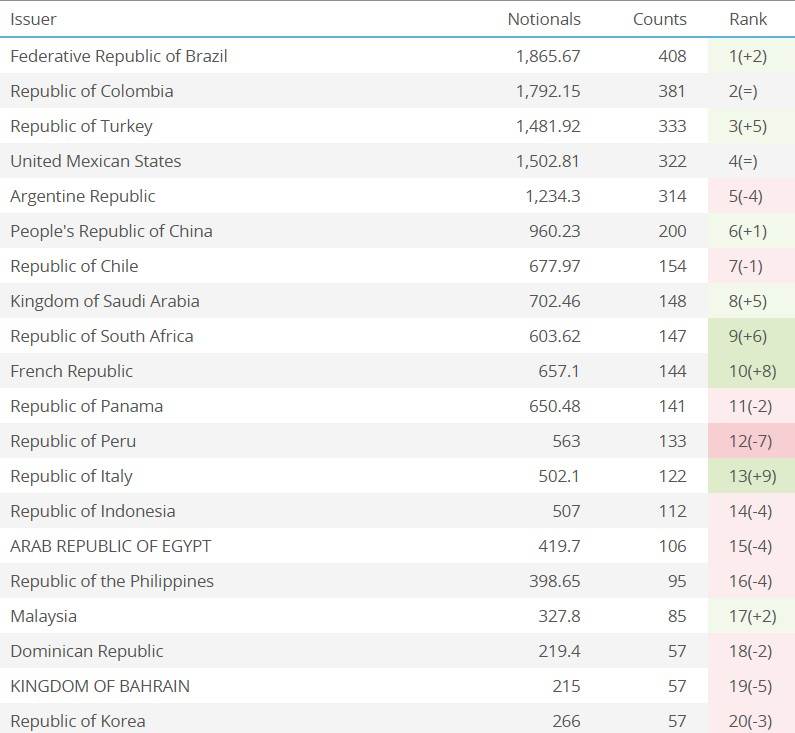
Table 1 – 20 most active USD sovereign names in September 2026. Source: SBSDRView
Table 1 shows the 20 sovereign names which traded more than 50 times and formed 83% of the total volume in September 2026 (with change in rank from August). We highlight the big changes in rank HoH from March below:
- Brazil led – overtaking Colombia and Turkey.
- Argentina moved up from eighth to fifth – up 45% in trade count.
- China moved down from fifth to sixth – down 43% in trade count.
- Names that moved by more than six places HoH included France (up 16 places), Italy (up eight places), and Korea (down 13 places).
Changing to EUR, we see the following:
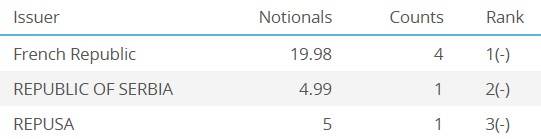
Table 2 – 4 most active EUR sovereign names in September 2026. Source: SBSDRView
Table 2 shows that:
- France traded four times in September 2026 – the same as March.
- The US is notable by absence and traded only once (in August) in the six months since March. (The US trades in EUR to avoid USD currency impacts of a US credit downgrade.)
US Corporates
Next, we look at the top 25 US corporates by trade count which made up 40% of the total trade count.
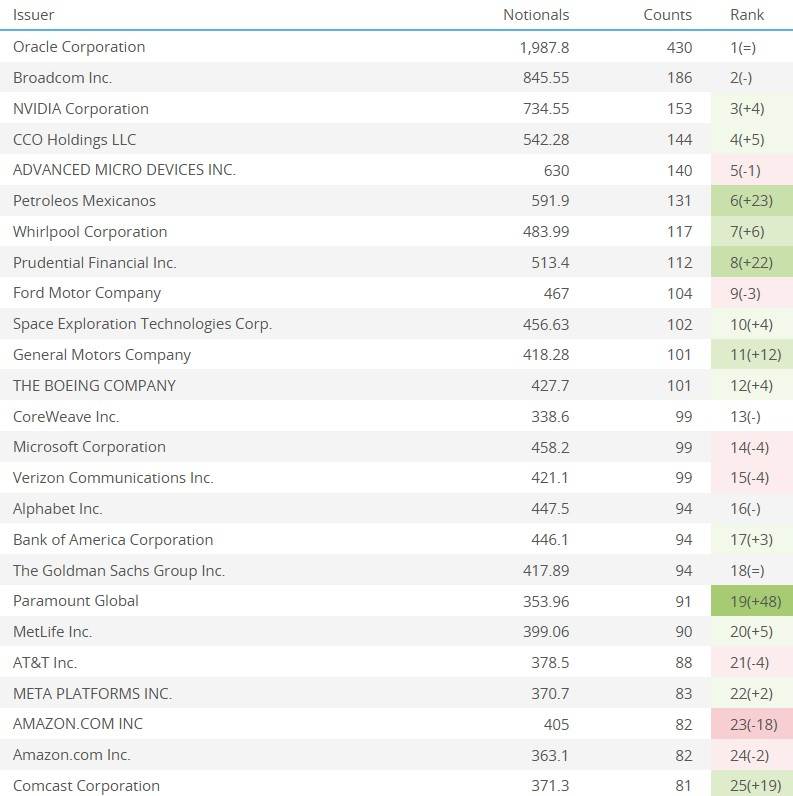
Table 3 – 25 most active US corporate names in September 2026. Source: SBSDRView
Table 3 shows the 25 most active US corporate names which each traded more than 80 times in September 2026 (versus more than 64 times in March). As context, the top 50 names traded more than 64 times (versus more than 46 in March), and the top 100 names traded more than 48 times (versus more than 30 in March). I highlight the HoH changes in rank greater than ten places:
- Six big tech names featured despite not having featured in the top 100 in March (each ascending more than 78 places): Broadcom, NVIDIA, Advanced Micro Devices, SpaceX, CoreWeave, and Meta.
- Three big tech names ascended by more than 55 places: Microsoft, Alphabet, and Amazon.
- Notably, Amazon has two reference names which, if combined into one, would have placed Amazon third in September trade count – up 4.3x in trade count from 73rd in March.
- Two financials descended by more than 80 places: Goldman Sachs and MetLife.
- Three other names descended 15 or more places: Petroleos Mexicanos, Boeing, Comcast.
EU corporates
Next, let us look at the top 30 EU Corporates by trade count which represented over 33% of the total trade count.
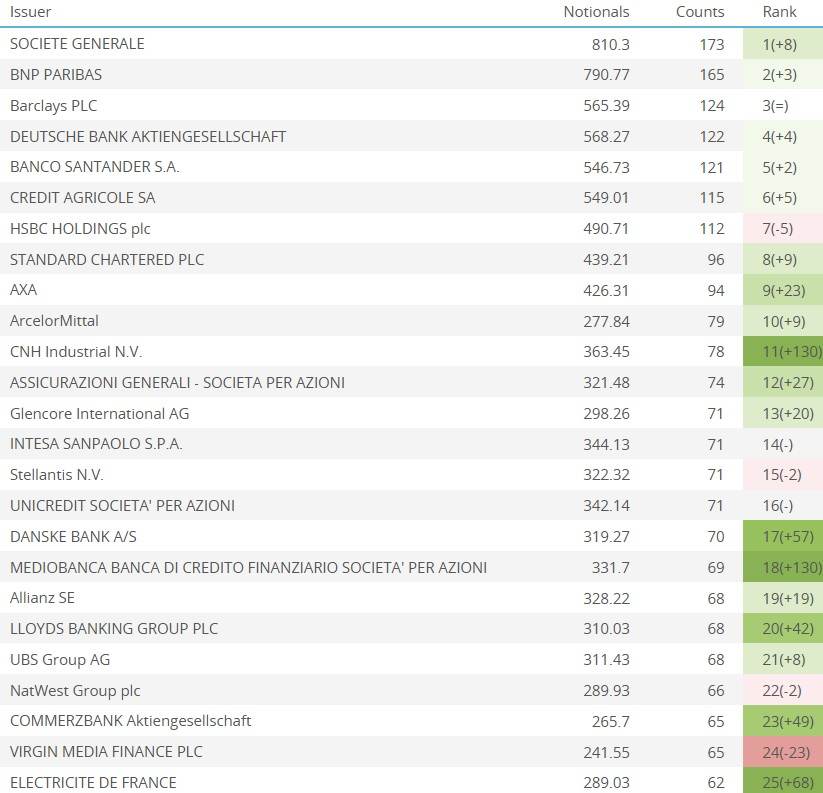
Table 4 – 25 most active EU corporate names in September 2026. Source: SBSDRView
Table 4 shows the 25 names which traded more than 61 times in September 2026. I highlight the names which rose in rank by more than 20 places HoH:
- Four financial names were in the September top 25 despite not having featured in the top 100 in March (each ascending more than 81 places): Axa, Intesa, Unicredit, and Mediobanca.
- Seven financial names ascended more than 20 places in the rankings: Credit Agricole, Standard Chartered, Danske Bank, Allianz, Lloyds, UBS, and NatWest.
- Two other names ascended 24 or more places: CNH and Glencore.
Japan corporates
Next, we look at Japanese corporates with more than 2 trades in September 2026.

Table 5 – Most active CDS Japanese corporates in September 2026. Source: SBSDRView
We see:
- Softbank ranked first by a long way with 43 trades – maintaining top spot HoH.
- Kawasaki was joint second with four trades – flat HoH in trade count and up from sixth.
- Nippon Paper was joint second with four trades – one more trade than HoH and up from 12th.
- Rakuten was third with three trades – down 8 trades HoH and down from second.
- The above does not show that more than half the JPY names traded twice in September and once in March, while a sizable further slice traded once or twice in September and not at all in March. This suggests JPY CDS is a nascent market for US party trading when compared with EUR and USD.
Overall single-name volumes
Let us put the names activity in context of month-by-month overall volumes, starting with US SDR-reported single-names.
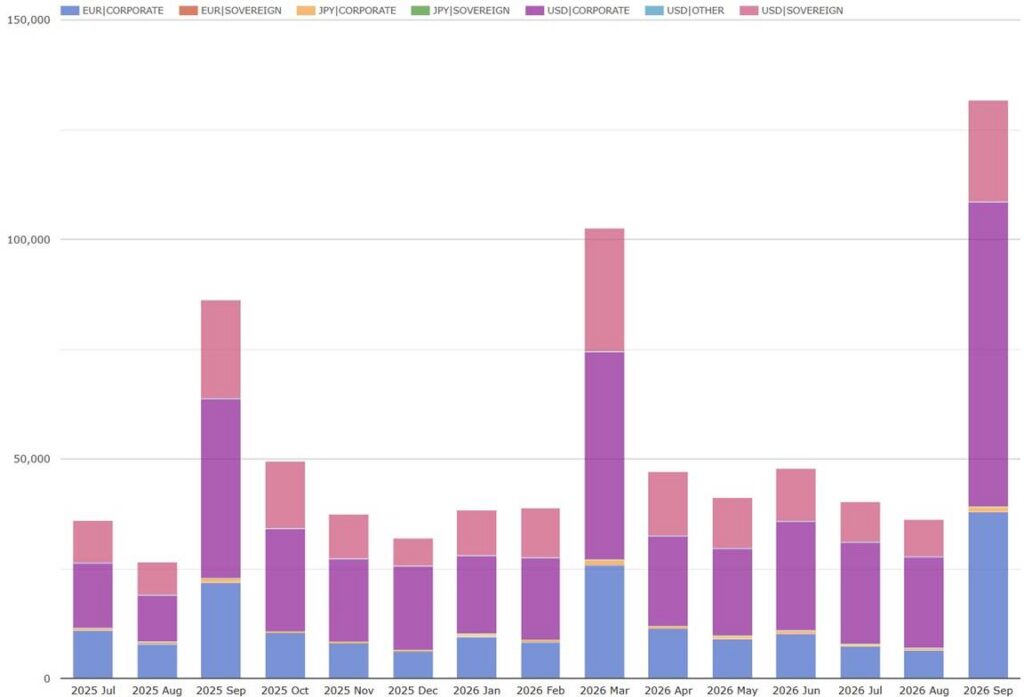
Chart 1: US-reported single-name CDS trade count. Source: SBSDRView
Chart 1 shows the expected pattern of peaks each March and September. September 2026 had a monthly peak of 30,965 trades – up 20% HoH from March 2026 and down 45% YoY from September 2025.
- USD corporates were the largest combination with 16,565 trades – up 34% HoH.
- EUR corporates were next with 8,790 trades – up 36% HoH.
- USD sovereigns were next with 5,287 trades – down 20% HoH and down 4.6% YoY.
- JPY corporates had 301 trades – down 2.3% HoH and down 15% YoY.
- EUR sovereigns traded 22 times – up 3.1x HoH and up 83% YoY.
Next, we have three CCPView charts showing global cleared single-names for USD, EUR, and JPY. Note: the y-axis scale varies significantly between the three charts.
Cleared single-name CDS trade counts by currency. Source: CCPView
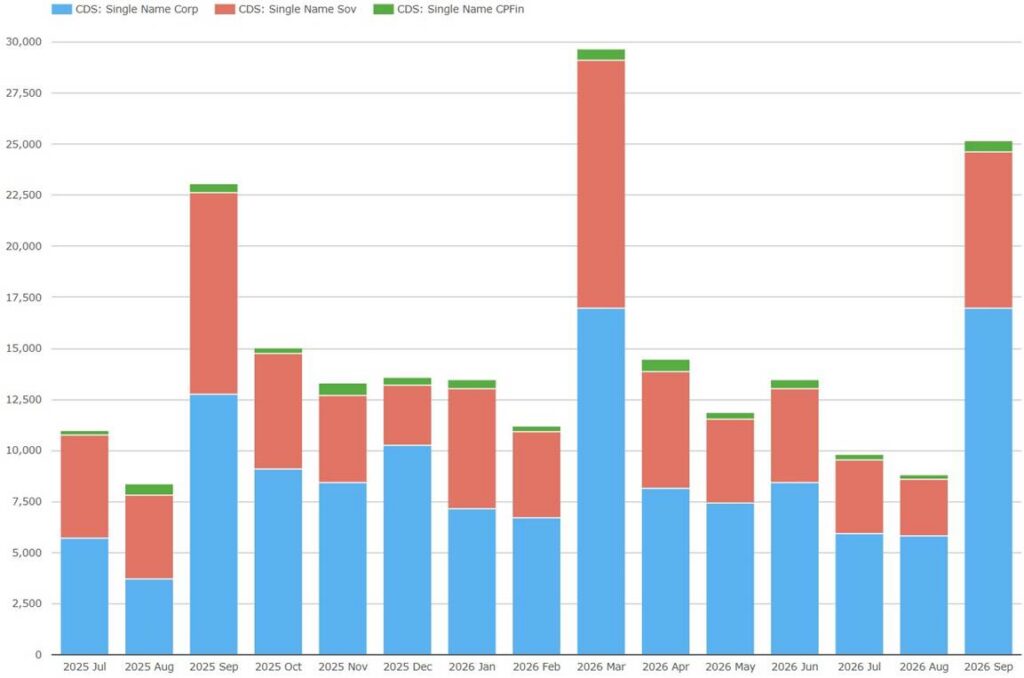
Chart 2: USD
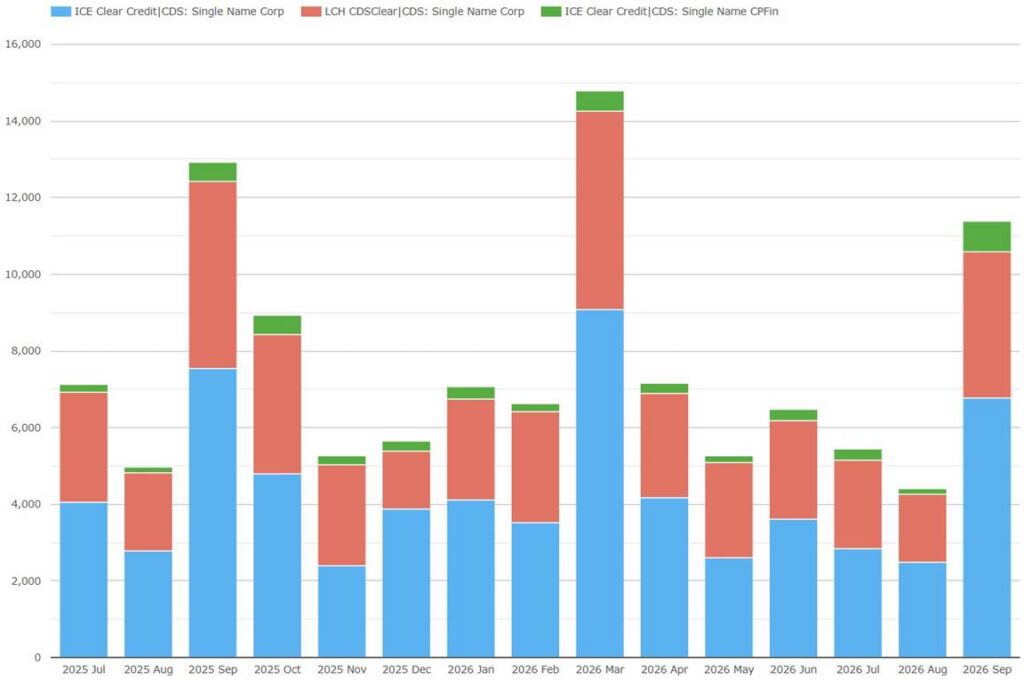
Chart 3: EUR
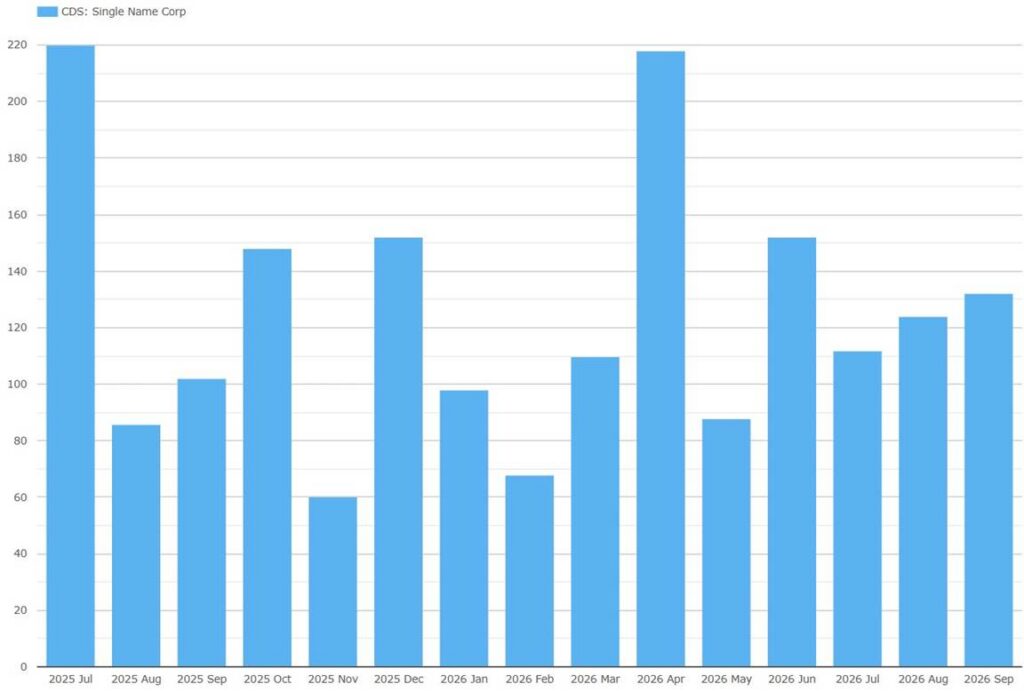
Chart 4: JPY
Charts 2 and 3 show the traditional peaks in March and September as hedges roll over close to the IMM dates in those two months. (Chart 4 shows the peaks in April and October because trades clear days after trade date at JSCC – shifting the JPY rollover spike past month end.)
Total cleared single-name CDS in September 2026 were 36,685 – down 18% HoH but up 1.7% YoY.
- USD corporates cleared 16,963 trades – flat HoH but up 33% YoY.
- USD sovereigns had 7,664 trades – down 37% HoH and down 22% YoY.
- USD CPFin trades were 547 trades – down 3.7% HoH but up 37% YoY.
- EUR corporates showed 10,574 trades – down 26% HoH and down 15% YoY.
- EUR CPFin trades were 805 trades – up 50% HoH and up 68% YoY.
- JPY corporates showed 132 trades – down 20% HoH and down 29% YoY.
In summary
Using the mountain of data in US SBSDRs, SBSDRView provides transparency, information, and insights on OTC Credit and Equity Derivatives.
- Other credit derivatives than single-name CDS covered include custom baskets, total return swaps, and exotics including up to five names.
- Our “most active” view highlights the names that trade most frequently each day/week/month.
- Our “custom” view allows you to design your own notional or trade count query tailored to the granularity of information you need. This might include specific transaction types, time-periods, currencies, product types and subtypes, cleared vs. uncleared, or on- vs. off-platform.
- From both views you can click through from the volumes to the individual trade details.
Please contact us, if you are interested in using SBSDRView.