
This blog covers Q3 2026 volumes of global cleared rates swaps risk-trading products focusing on OIS, fixed-float IRS, and zero-coupon swaps – including each product for a currency if it had a material volume share. We exclude FRAs (primarily used for reset exposure hedging) and basis swaps (primarily used for interest rate basis hedging).
Key takeaways
In Q3 2026, rates swaps cleared US$297 trillion notional – up 23% year-on-year (YoY) but down 6.6% from their Q1 2026 record.
- USD Fed Funds OIS and SOFR OIS combined volumes set a new high of US$99.9 trillion – up 15% YoY from the Q3 2025 high.
- EUR Euribor IRS and €STR OIS combined cleared €73.7 trillion – up 47% YoY but 3.5% off their Q2 2025 high.
- GBP SONIA OIS saw £25.9 trillion – down 14% YoY and 51% off their Q1 2026 record.
- JPY TONA OIS had ¥4,583 trillion – up 55% YoY but 2.4% off their Q4 2025 record.
- AUD BBSW IRS and AONIA OIS combined cleared A$25.2 trillion – up 38% YoY but 24% off their Q1 2026 record.
- CAD CORRA OIS totaled C$8.74 trillion – down 11% YoY and 23% off their Q1 2026 record.
- Non-major currencies’ IRS, OIS, and ZCS totaled US$26.3 trillion – up 32% YoY but 6.9% off their Q1 2026 record.
The charts below graphically differentiate the currency dynamics.
Note: this blog continues the level of granularity of its Q2 edition and holds over discussion of CCP market shares to the coming blog on that topic (Q2 edition here).
USD Fed Funds and SOFR OIS
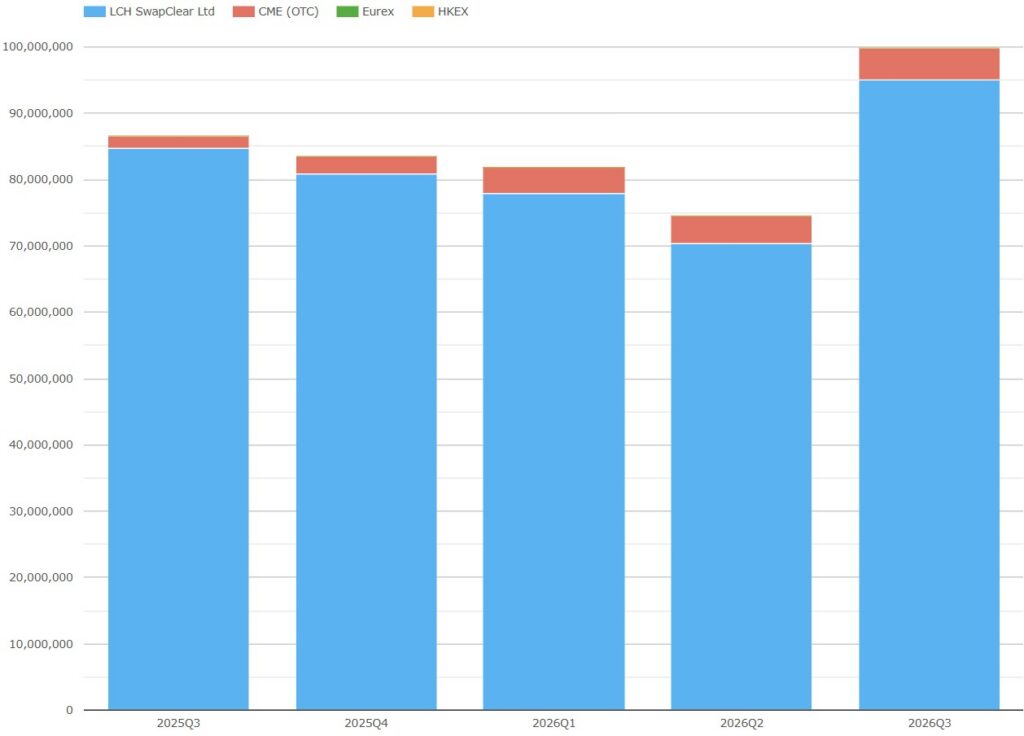
Chart 1: USD OIS volumes (single-sided gross notional US$ millions). Source: CCPView
Chart 1 shows that Q3 2026 USD Fed Funds OIS and SOFR OIS had record combined volumes of US$99.9 trillion – up 15% YoY from the Q3 2025 record of US$86.6 trillion.
- LCH SwapClear saw US$95.1 trillion – up 12% YoY from the Q3 2025 high of US$84.7 trillion.
- CME OTC had US$4.81 trillion – up 2.5x YoY and up 13% QoQ from the Q2 2026 high of US$4.25 trillion.
EUR Euribor IRS and €STR OIS
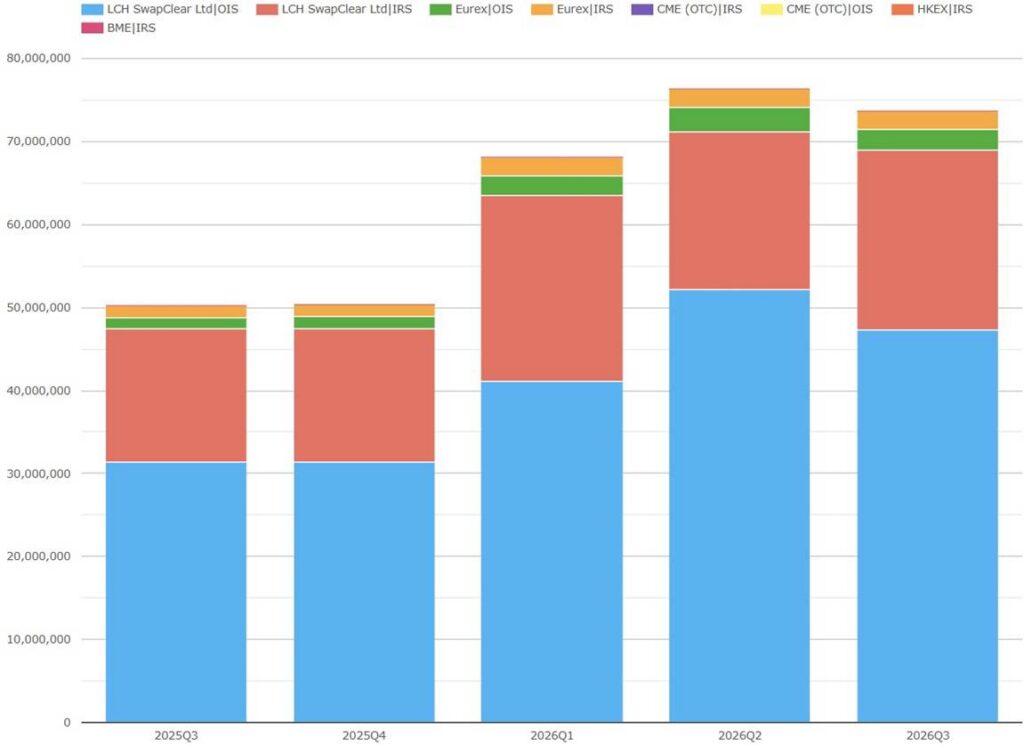
Chart 2: EUR Euribor IRS and EONIA OIS volumes (single-sided gross notional EUR millions). Source: CCPView
Chart 2 shows that Q3 2026 EUR Euribor IRS and EONIA OIS had combined volumes of €73.7 trillion – up 47% YoY but down 3.5% from the Q2 2026 record of €76.3 trillion. At an FX rate of 1.135, the total is equivalent to US$83.6 trillion.
- LCH SwapClear had €69.0 trillion – up 46% YoY but down 3.1% from the Q2 2025 record of €71.2 trillion.
- Eurex cleared €4.69 trillion – up 67% YoY but down 9.0% from the Q2 2025 record of €5.15 trillion.
EONIA OIS was 67.6% of the Q3 2026 total – down from 72.2% in Q2 2026 and at similar levels to the preceding three quarters.
GBP OIS (SONIA)
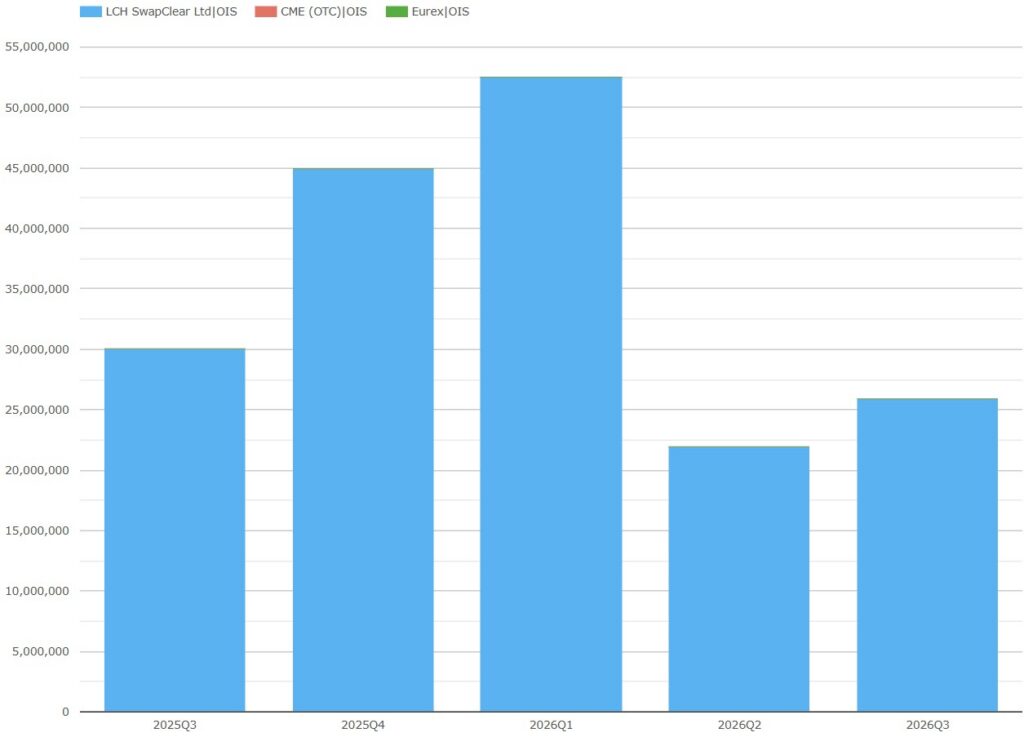
Chart 3: GBP OIS volumes (single-sided gross notional in GBP millions). Source: CCPView
Chart 3 shows that Q3 2026 GBP SONIA OIS totaled £25.9 trillion – down 14% YoY and down 51% from the Q1 2026 record of £52.5 trillion. At an FX rate of 1.323, the total is equivalent to US$34.3 trillion.
JPY OIS (TONA)
Here, we exclude the sustained small volume of JPY DTIBOR IRS which is well below 1% of JPY swaps volume.
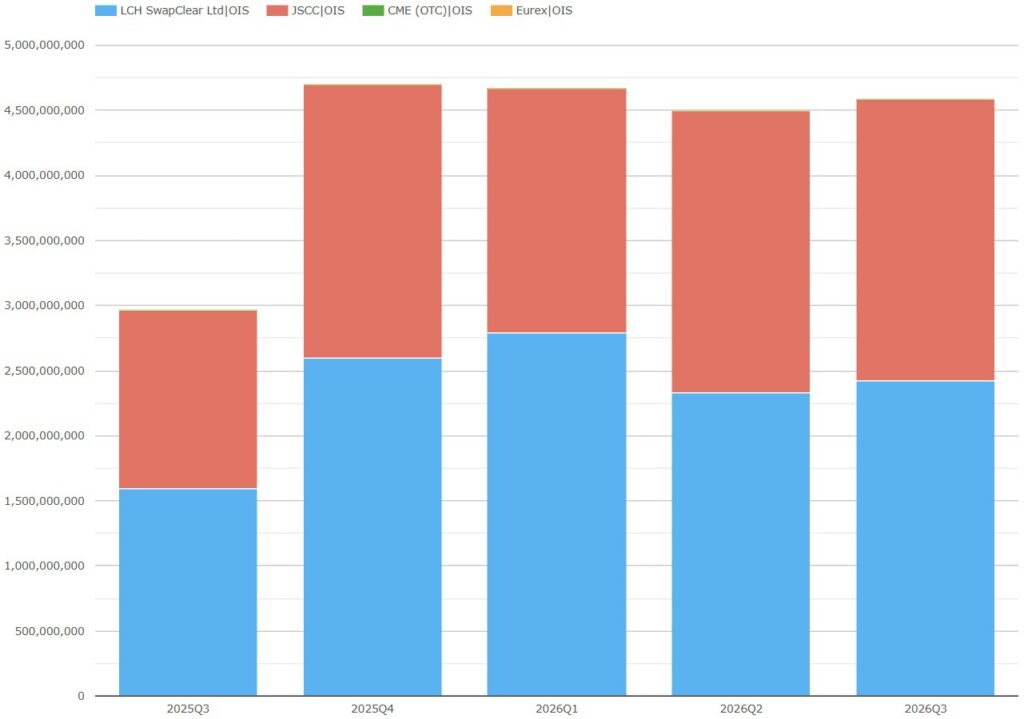
Chart 4: JPY OIS volumes (single-sided gross notional in JPY millions). Source: CCPView
Chart 4 shows that Q3 2026 JPY TONA OIS totaled ¥4,583 trillion – up 55% YoY but down 2.4% from the Q4 2025 record of ¥4,698 trillion. At an FX rate of 157.4, the total was equivalent to US$29.1 trillion.
- LCH SwapClear had ¥2,421 trillion – up 52% YoY but down 13% from the Q1 2026 high of ¥2,787 trillion.
- JSCC had ¥2,162 trillion – up 58% YoY and only slightly below the Q2 2026 high of ¥2,164 trillion.
AUD IRS (BBSW) and OIS (AONIA)
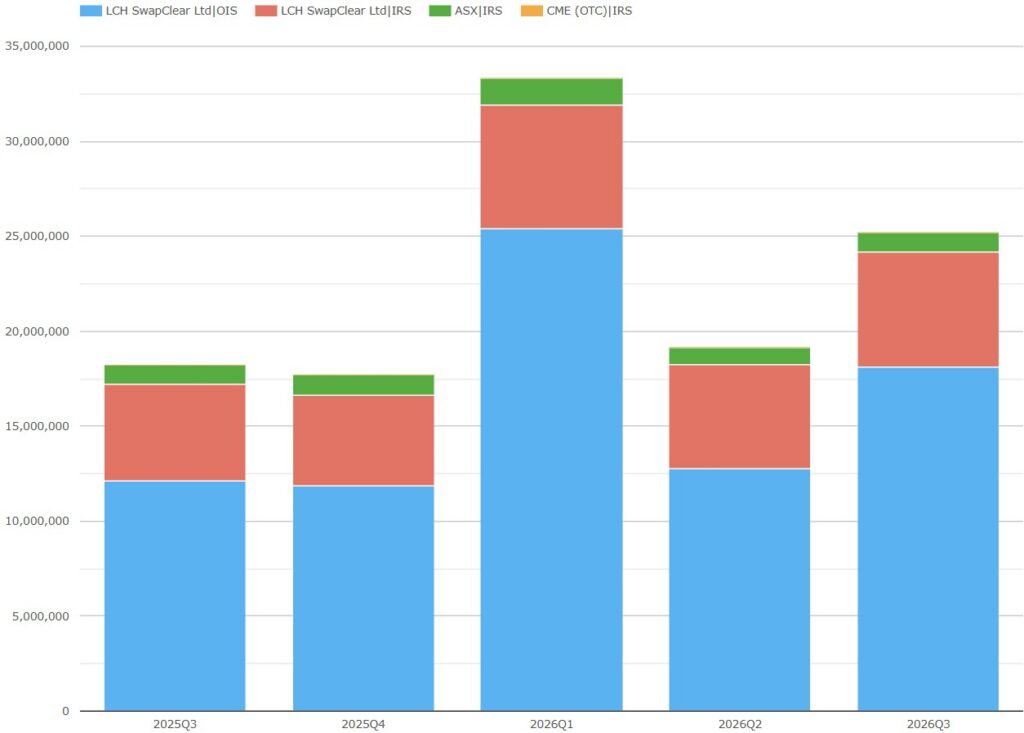
Chart 5: AUD IRS and OIS volumes (single-sided gross notional in AUD millions). Source: CCPView
Chart 5 shows that, in Q3 2026, AUD IRS and OIS had combined volumes of A$25.2 trillion – up 38% YoY but down 24% from the Q1 2026 record of A$33.3 trillion. At an FX rate of 1.43, the total is equivalent to US$17.6 trillion.
- LCH SwapClear had A$24.2 trillion – up 41% YoY but down 24% from the Q1 2026 high of A$31.9 trillion.
- ASX had A$1.05 trillion – up 1.3% YoY but down 27% from the Q1 2026 high of A$1.44 trillion.
- CME had A$135 million – up YoY from A$4.8 million but down from the Q4 2025 high of A$1.68 billion.
AONIA OIS was at least 71.7% of the Q3 2026 total – down from at least 76.3% in Q1 2026.
CAD OIS (CORRA)
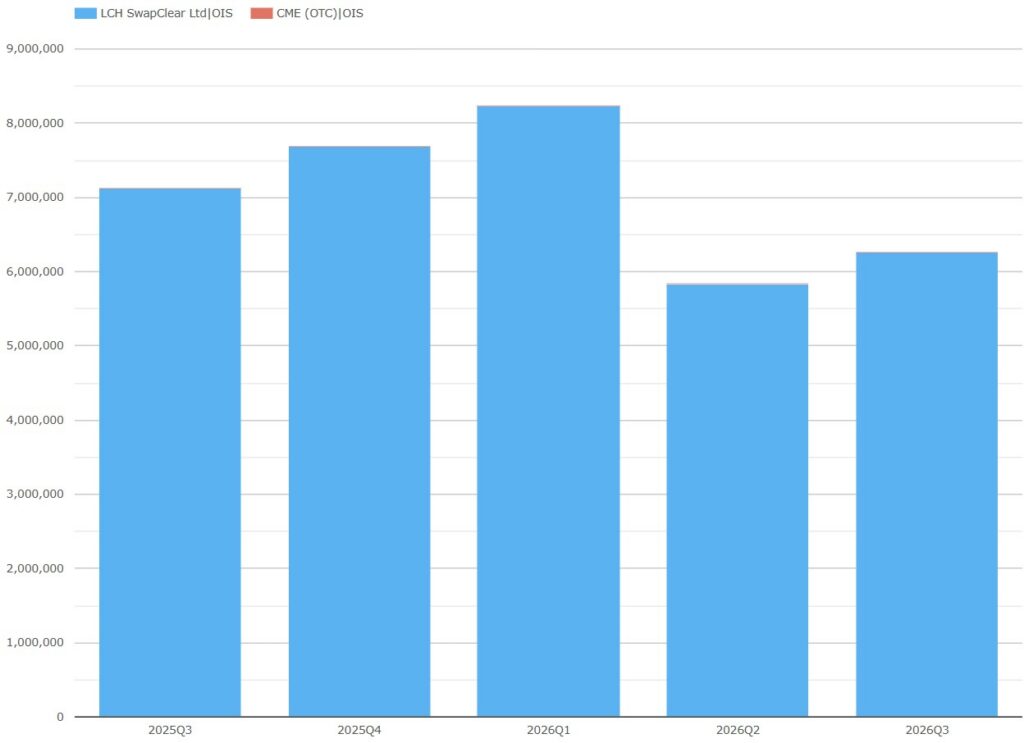
Chart 6: CAD OIS volumes (single-sided gross notional in CAD millions). Source: CCPView.
Chart 6 shows that, in Q3 2026, CAD CORRA OIS totalled C$8.74 trillion – down 11% YoY but down 23% from the Q1 2026 record of C$11.3 trillion. At an FX rate of 1.419, the total is equivalent to US$6.16 trillion.
Non-major currency IRS, OIS, and ZCS
We chart non-major currencies cleared swap activity in a single chart for all three regions. Non-major currencies made up less than 9% of the Q3 2026 all-currency volume. We include zero coupon swaps (ZCS) which are the majority of BRL and CLP swaps, a small minority of CZK swaps, and below 0.4% for all other currencies rate swaps.
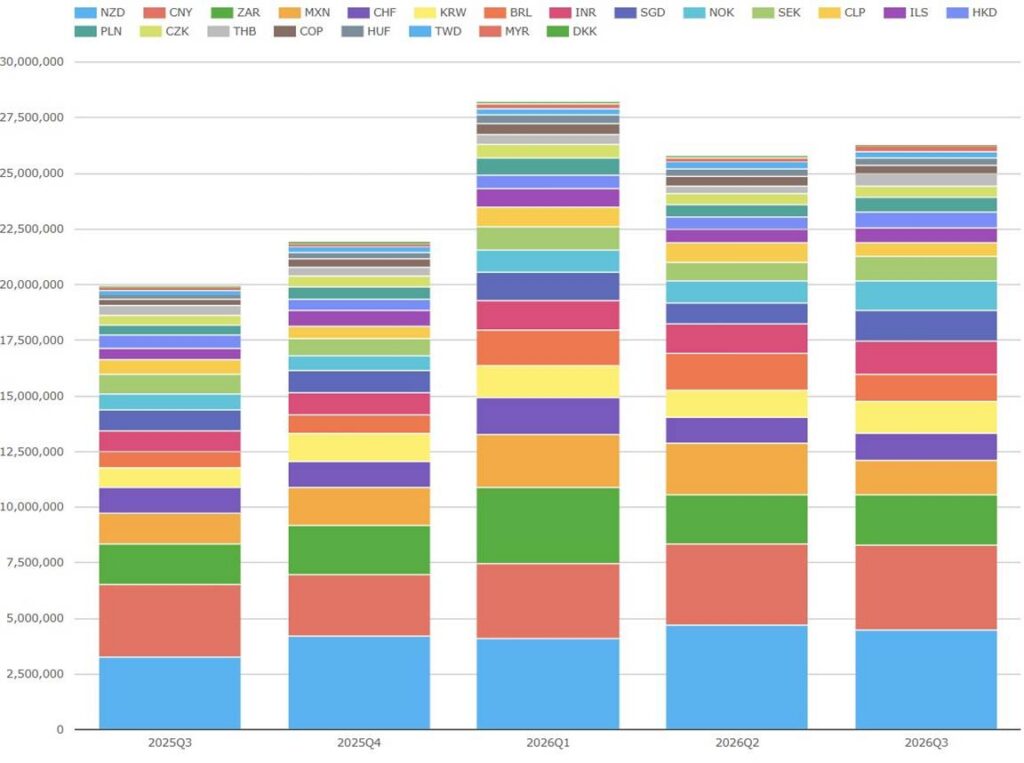
Chart 7: Non-major currency IRS, OIS, and ZCS volumes (single-sided gross notional in US$ millions). Source: CCPView.
Chart 7 shows that Q3 2026 IRS, OIS, and ZCS in non-major currencies totaled US$26.3 trillion – up 32% YoY but down 6.9% from the Q1 2026 record of US$28.2 trillion.
- There was YoY volume growth in all currencies except CLP and DKK.
- There were new volume highs in CNY, INR, KRW, SGD, NOK, SEK, HKD, THB, TWD, and MYR.
The top eleven currencies were US$21.3 trillion (81% of the volume) – up 33% YoY but down 5.8% from the Q1 2026 high of US$22.6 trillion.
- NZD was the largest currency at US$4.47 trillion – up 37% YoY but down 4.7% QoQ.
- CNY was second largest with US$3.84 trillion – up 18% YoY.
- ZAR was third largest with US$2.22 trillion – up 20% YoY.
- MXN slipped below ZAR with US$1.56 trillion – up 15% YoY but down 33% QoQ.
- INR saw US$1.48 trillion – up 59% YoY.
- KRW yielded US$1.44 trillion – up 66% YoY.
- SGD had US$1.38 trillion – up 49% YoY.
- NOK showed US$1.29 trillion – up 75% YoY.
- CHF was US$1.23 trillion – up 4.6% YoY.
- BRL slipped five places with US$1.21 trillion – up 66% YoY but down 26% QoQ.
- SEK saw US$1.14 trillion – up 31% YoY.
The remaining eleven currencies (HKD, ILS, PLN, CLP, CZK, THB, COP, TWD, HUF, MYR, and DKK) made up US$4.99 trillion (19%) of the non-major currency volume – up 26% YoY but down 11% from the Q1 2026 high of US$5.63 trillion.
That’s it
The seven charts here gave us a global overview of all currencies’ Q3 2026 core product cleared rate swaps volumes.
The volumes in CCPView cover more cleared instruments, volume metrics, and analysis parameters.
- Cleared instruments also include exchange traded futures and options and cash US Treasuries.
- Volume metrics also include trade count / DV01 / average daily volume (ADV), open interest (OI), OI change, and notional unwound/matured.
- Analysis parameters also include day / week / month / year, exchange, product subtype, tenor, and activity type (meaning D2C or D2D trade).
For more details, please contact us for a CCPView demonstration.