- 43% of GBP risk transacted in Q2 2020 was in SONIA.
- And only 24% of GBP notional was in LIBOR.
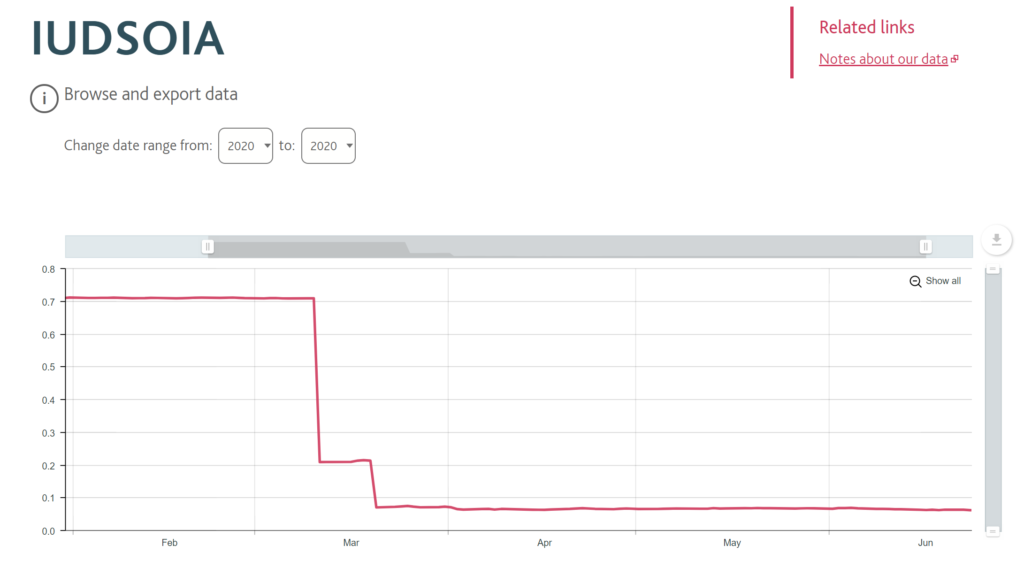
- Now that volatility has died down somewhat there is less short-dated trading activity.
- Can we consider the market standard as SONIA yet?
The first Monday in March 2020 will likely be remembered for many reasons. It was the day before the Fed launched the first emergency rate cut (by 50 basis points). It was probably the final day when Rates markets were trading in “pre-crisis” mode. How funny it is when I look back at the SONIA Live Blog and see May MPC described as “plummeting” when it traded at 36.9 basis points. It settled at around 6.5bp!
Following that, we had a whole bout of speculative trading around negative rates in the UK.
What has this done for the balance of SONIA and LIBOR risks in the market? Has the recent LIBOR announcement/non-announcement changed things?
Percentage of Cleared Notional in SONIA
Looking at notional amounts first;
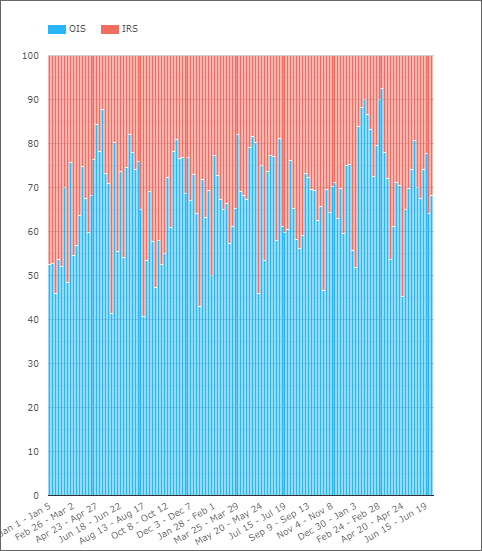
Showing;
- The percentage cleared at CCPs in GBP IRS (i.e. vs LIBOR) and GBP OIS (vs SONIA) each week since 2018.
- Our previous SONIA Update looked at the first week of March, when 92% of notional volume was transacted versus SONIA.
- Clearly, with all of the short-end activity related to central banks cutting rates back to zero this skewed activity in the first two weeks of March.
- Since that high-point, it has been more typical for SONIA to make up around 70% of traded notional.
- Q2 2020 as a whole saw 76% of GBP notional cleared at LCH SwapClear versus SONIA.
DV01 of SONIA Traded
Just as we did in the live blog, let’s also analyse the amount of risk that has traded in SONIA relative to LIBOR. This excludes Basis trades (float vs float) which are a surprisingly small part of the GBP market.
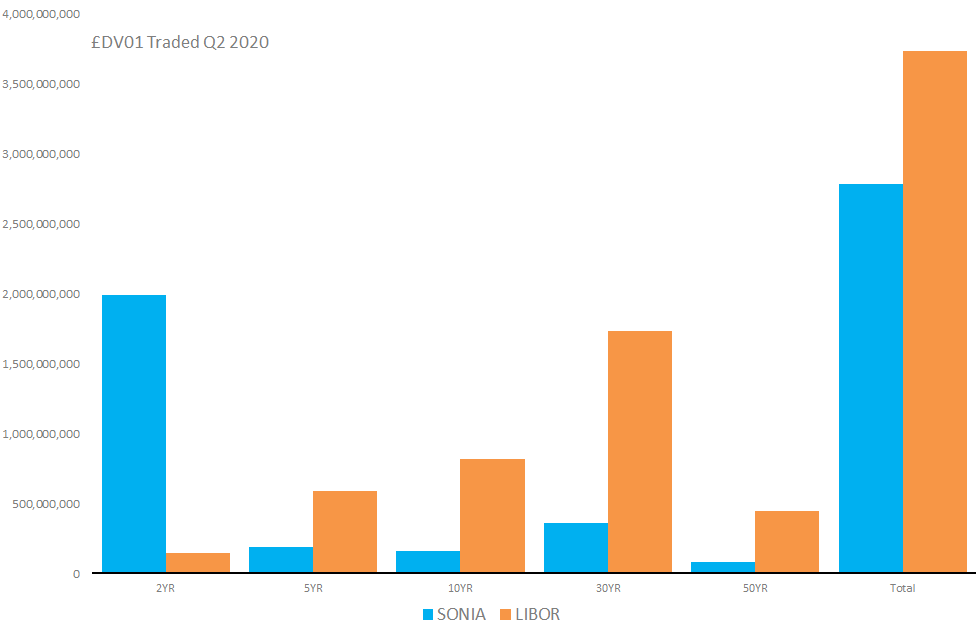
Showing;
- DV01 in GBP cleared at LCH SwapClear for three months March-June 2020 in GBP IRS (LIBOR) and GBP OIS (SONIA).
- The data we have is separated into 5 tenor buckets (2YR, 5YR, 10YR, 30YR and 50YR) as shown above.
- On a risk adjusted basis, 43% of risk was traded in SONIA (the rest in GBP LIBOR). This is across all tenors.
- This is considerably lower than the picture painted by notional amounts, due to the continued dominance of LIBOR trading in tenors longer than 2 years.
Looking at some maturity splits;
- 72% of total SONIA risk was transacted in the 2 year tenor.
- And relative to LIBOR in 2YR, 93% of all 2 year risk was transacted versus SONIA.
- In 5YR tenors, SONIA risk accounted for 24% of DV01.
- In 10YR tenors, SONIA risk accounted for 16% of DV01.
- The same can be said for 30YR and 50YR tenors – around 15% of the market is in SONIA.
- Just as our live blog showed, long-dated trades continue to be dominated by LIBOR.
2020 SONIA Risk
It is worth looking at SONIA risk transacted during Q2 2020 in two different ways. Longer than 2YR and the 2YR risk itself:
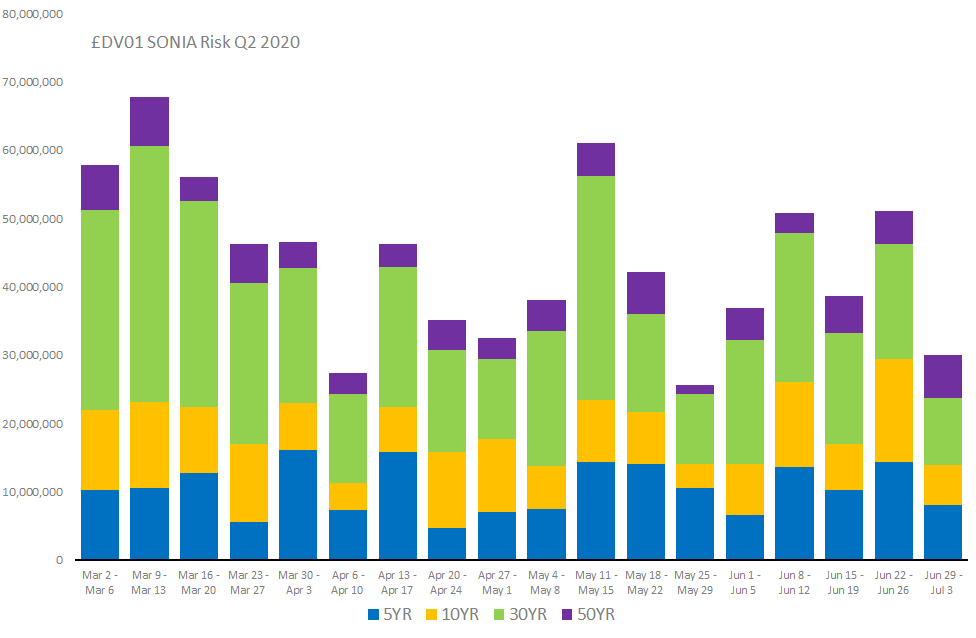
For the long-dated risk we find;
- There is consistently more risk executed in 30YR SONIA in most weeks than in 10YR. This is surprising given that liquidity should be pretty straight-forward to transform from the Gilt (10YR) future into SONIA equivalents.
- Readers of our previous SONIA blog will remember that January 2020 saw considerably more risk traded in SONIA markets than we are witnessing at the moment. Total activity remains well short of the ~£110m DV01 that was transacted in the last week of January 2020.
- The amount of long-dated SONIA risk being transacted each week is fairly consistent.
And what about the short-end in Q2 2020? With all of the talk of negative rates, were there fireworks?
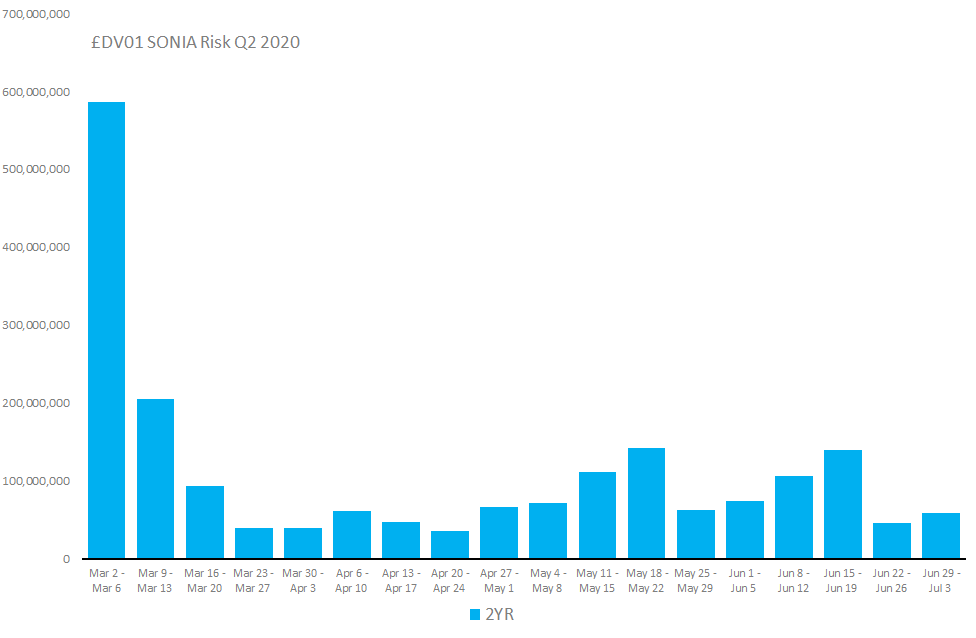
Showing;
- There’s a chart that tells a story!
- The sheer degree of trading activity in the first week of March is phenomenal relative to subsequent history.
- Since that week, no “fireworks” have been seen around negative rates.
- Tellingly, 40% of the total 2YR risk traded during the whole quarter was transacted during the first two weeks of March!
2020 SONIA Risk vs LIBOR Risk
I think that 2YR chart shows how unusual the beginning of March was in terms of market conditions. Therefore, let’s focus on the right hand side of the chart below:
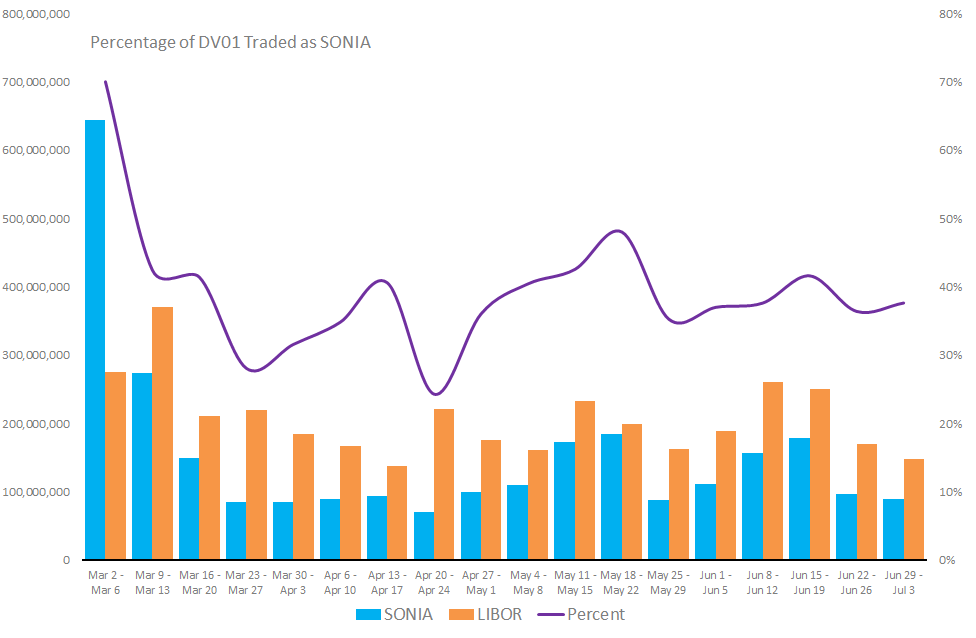
Showing;
- In our transition week of March 2nd, 70% of GBP risk cleared at LCH SwapClear was in SONIA. However, this was a very unusual week.
- Over the subsequent weeks, the amount of SONIA risk trading has been fairly consistent.
- Starting in April, ~40% of risk has been transacted in SONIA each week.
- The average over the whole of Q2 2020 was 43%.
In Summary
- 43% of GBP risk transacted in Q2 2020 was versus SONIA.
- In shorter maturities (2YR), 93% of risk is transacted as a SONIA product.
- In maturities ranging from 5YR to 50YR, between 15% and 25% of risk is SONIA.
- 5YR and 10YR liquidity is still concentrated in LIBOR-based products.
- When measured by notional, 76% of trading activity was versus SONIA in Q2 2020.