Authored by, Serena Manti and Gianluca Molteni of the Financial Engineering and A.I. team at List.
This is the follow-up of our first post introducing the paper “Parsimonious HJM-FMM Model with the New Risk-Free Term Rates“. Here, we would like to provide you with a brief more technical description of our innovative HJM-FMM model, followed by the presentation of our findings and related conclusions.
As we already mentioned in the previous post, our model is an extension of the classic HJM framework, built in order to generate the dynamics of the extended forward rates, that are equivalent to the FMM ones. This is precisely accomplished by matching the FMM dynamics using a parsimonious (finite-dimensional) Markovian HJM model with separable volatility parameters.
In particular, by adopting a specific model realization with a deterministic volatility, we have been able to draw expressions for the dynamics of the risk-free forward and swap rates, as well as valuation Black-like formulas for derivatives on these rates (caps and swaptions), which have been later used for the purpose of model calibration.
In this regard, we would like to remark that:
- Thanks to the peculiar FMM concept of extended zero-coupon bond and its associated probability measure, the so-called extended T-forward measure (Lyashenko and Mercurio, 2019), the RFR forward and swap rate dynamics are defined for all times, even those beyond their natural expiries.
- Besides the standard features held by the IBORs, such as the martingale property (i.e. no drift term in their dynamics) under the related forward measure, the new RFRs supply extra information, such as the rate dynamics under the classic money-market risk-neutral measure.
- Given the martingale property, we can assume specific dynamics of the RFR forward and swap rates and price their derivatives accordingly (for example, by assuming a geometric Brownian motion, we can write the swaptions price through the usual Black formula).
- Since, within our specific formulation, the two rate dynamics are basically of the same form, the pricing procedures of their derivatives constitute essentially the same mathematical problem. And this has somewhat simplified our analysis.
For those interested in the complete technical treatment and the final pricing formulas, please refer to the full paper.
Results
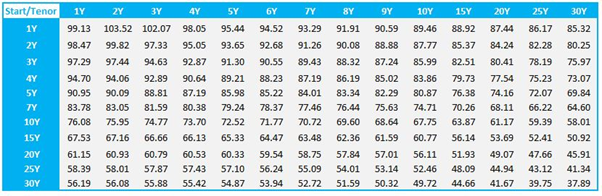
In order to calibrate our model, we have extracted market data from the Reuters platform on 25th May 2022. Note that, at the time we started working on it, the availability of market data was not so readily available as now, given the then scarcity of derivatives indexed to the RFRs.
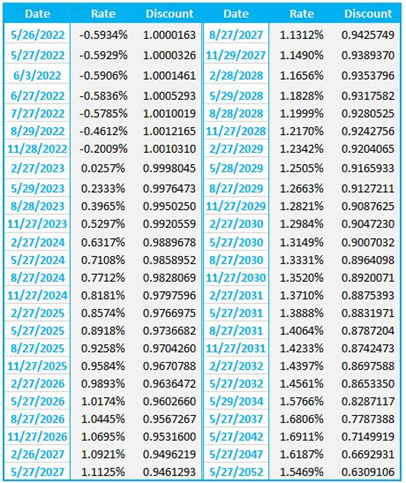
on 25th May 2022
The results we are going to present have been obtained through a two-step procedure.
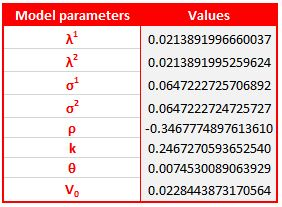
- Calibration of a certain model to the above market data.
- Employment of a specific technique to get the swaptions price.
All pricing calculations have been made by setting 25th May 2022 as the trade date.
To evaluate the outcomes, a benchmark approach is exploited which combines the calibration through the Hull-White (HW) model, with the usage of a pricing technique named trinomial tree. Our HJM-FMM model is instead used in conjunction with a pricing method called Monte Carlo. In particular, for Bermuda swaptions, the price has been obtained through the use of the Longstaff-Schwartz algorithm for the valuation of path-dependent options.
Let’s look at the calculation results.
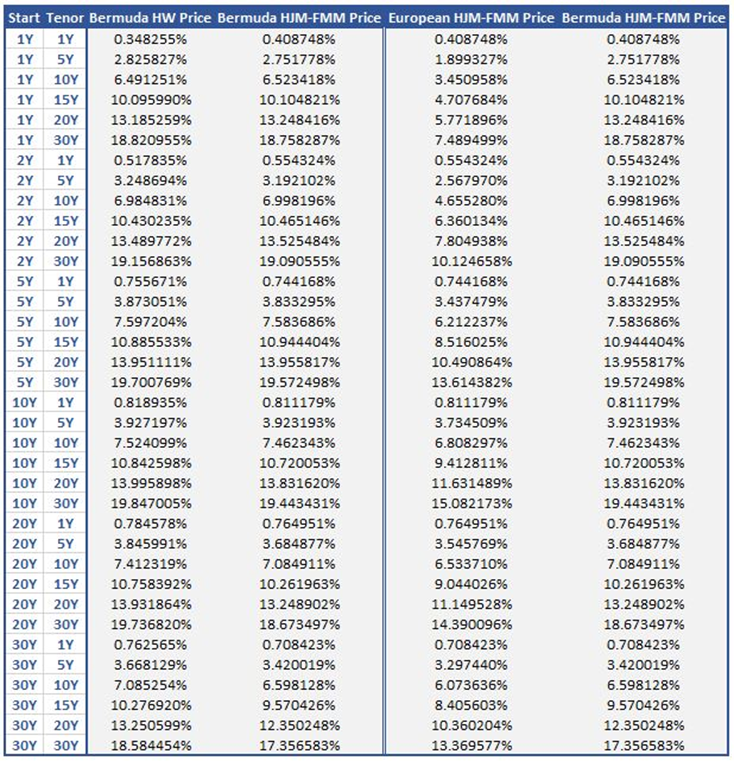
From these tables and plots, we notice that:
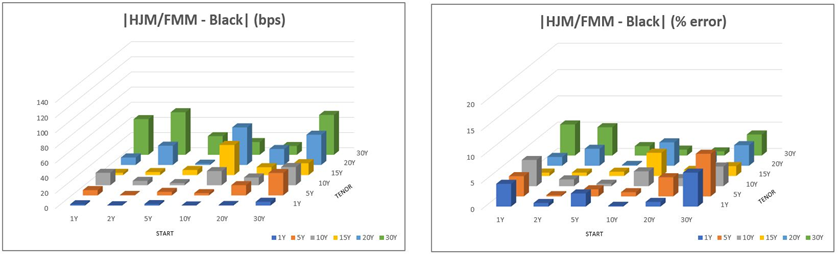
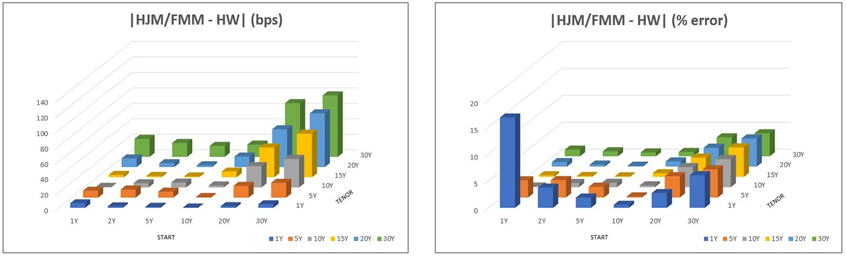
- The HJM-FMM pricing results for European swaptions are consistent with the benchmark prices of Black model (note from Figure 1 that the percentage errors between the two models are within 5% for almost all the options analysed).
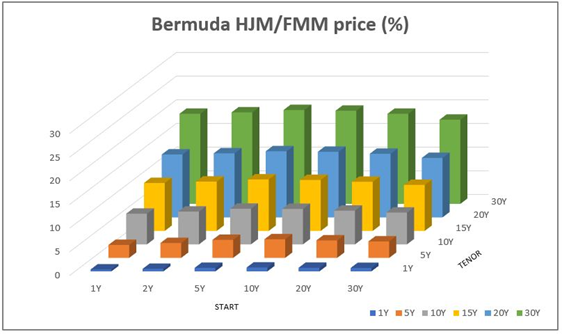
- As tenor rises, the Bermuda swaptions HJM-FMM prices tend to increase significantly (Figure 2) and the absolute errors compared to HW grow quite accordingly, especially for long starts (Figure 3 – left; see also left part of Table 4). These differences may be due to the two different numerical methods we adopted. However, notice how the percentage errors, apart from the 1Y/1Y case, remain below 5% for all options (Figure 3 – right).
- The resulting prices of Bermuda swaptions are always greater than those of the corresponding European swaptions (Table 4 – right), as it should be.
We consider all of these observations as valid proofs of the soundness of our results.