
This blog covers volumes of activity resulting from D2D platform reset runs a.k.a. multilateral reset optimization (MRO) for Q2 2026.
Key takeaways
In Q2 2026, Tradition (Trads) MRO took 15% of D2D platform reset-hedging activity in currencies where MROs operate.
- Of D2D platform EUR FRAs notional volume, $13.5 trillion or 86% were from MRO of which Trads MRO took 14.9 points at the expense of OSTTRA Reset (down 8.9 points) and Tullett Prebon (Tulletts) Matchbook (down 6.6 points).
- Of D2D platform SEK, NOK, CZK, PLN, and HUF FRAs notional volume, $498 billion or 82% were from MRO of which Trads MRO took 13.6 points at the expense of Matchbook (down 1.8 points) and bilateral reset-hedging on Tulletts entities (down 4.2 points) and ICAP entities (down 2.9 points).
- Of D2D platform AUD, NZD, and ZAR SPS notional volume, $978 billion or 95% were from MRO of which Trads MRO took 22.0 points at the expense of Reset (down 6.6 points), Matchbook (down 2.0 points), and bilateral reset-hedging on ICAP entities (down 8.1 points).
The marked uptick in MRO competition between D2D platforms prompts more frequent future posts on the topic.
Background
Reset hedging is the reduction of a swap portfolio’s exposure to sudden rate changes near a reset date by trading offsetting one-period interest rate swaps (either forward rate agreements (FRA) or single-period fixed float interest rate swaps (SPS)) to reduce the impact of near-term fixings in the portfolio.
Vendor platforms developed MRO to enable bulk reset hedging via scheduled multilateral runs to reduce trading desks weekly bilateral reset hedging effort. The vendors involved are OSTTRA Reset (REST), Tulletts Matchbook (TPSE) and Trads MRO (TSEF).
While REST is a pure-MRO entity, TPSE and TSEF support both MRO and bilateral reset-hedging. Luckily we can use patterns of spikes in daily platform volume plots (“spike days”) to distinguish MRO from bilateral reset-hedging on those platforms.
My reset optimization blogs last year – part 1 – FRA activity and part 2 – SPS activity – identified H1 2025 spike days which indicated:
- FRA MRO by Reset and Matchbook in EUR, and by Reset in SEK, NOK, CZK, PLN, HUF, and DKK.
- SPS MRO by Matchbook, Trads and Reset in AUD, by Reset in ZAR, and by Matchbook in NZD.
In Q2 2026, these product and currency combinations were 98.7% of all D2D FRA and SPS activity. The five currencies making up the remaining 1.3% showed no spike day pattern in Q2 2026 and are not covered further.
What was different in Q2 2026 was the increase in MRO vendor competition led by a dramatic expansion in Trads MRO activities. Read on for the analysis using data and charts pulled from SDRView.
D2D platform EUR FRAs


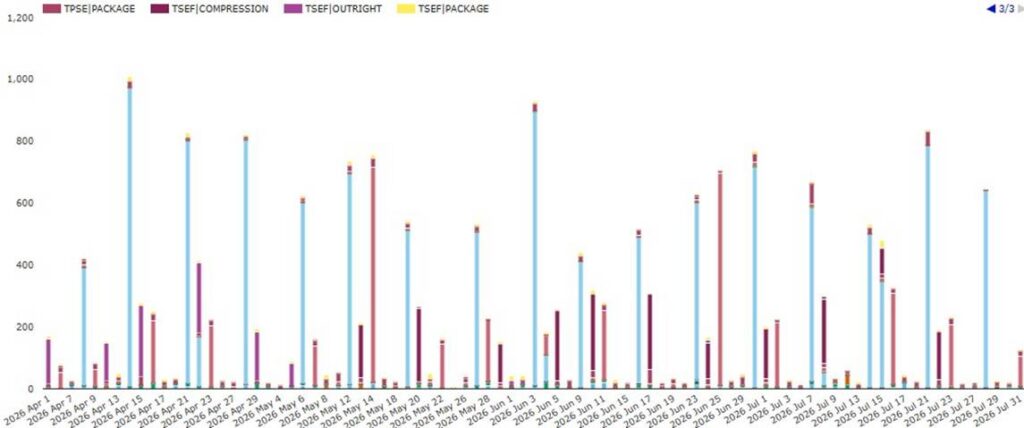
Chart 1: D2D EUR FRA volumes by date, platform and package type (notional USD millions). Source: SDRView
Chart 1 illustrates the spike days in EUR FRA in Q2 2026:
- OSTTRA Reset (REST) had $8.49 trillion of compression spikes usually on Tuesdays – with four changes to Wednesday (8 April, 6 May, 27 May, and 3 June) and two days where volume seems to have spilled over from the previous day’s run (22 April and 4 June).
- Tulletts Matchbook (TPSE) had $2.65 trillion of outright spikes usually on Thursdays – with one change to Friday (22 May).
- Tradition (Trads platform id TSEF) had $2.34 trillion of outright or compression spikes usually on Wednesdays – with one change to Tuesday (5 May) and three changes to Friday (10 April, 29 May, and 5 June).
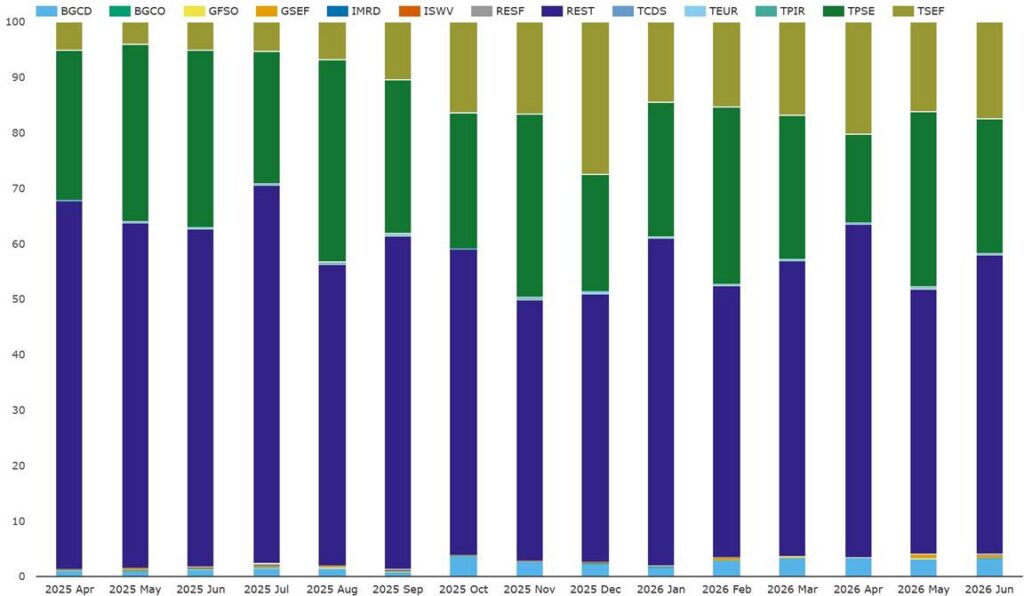
Chart 2: D2D platform EUR FRA platform shares (percentage of USD notional). Source: SDRView
Chart 2 illustrates the same data as Chart 1 plotted as monthly percentages by platform across the five quarters from Q2 2025 to Q2 2026. Computing quarterly shares from the underlying monthly notional volumes we can compare YoY between Q2 2025 and Q2 2026:
- OSTTRA Reset’s (REST and RESF) share declined by 8.9 points to 54.2%. Note: the RESF entity seems to have been retired.
- Tulletts TPSE entity’s share declined by 6.6 points to 23.7%of which 18.7 points was Matchbook activity.
- Trads’ TSEF share increased by 13.3 points to 18.0% of which 15 points was MRO activity.
- BGC’s non-MRO reset hedging share (combining BGCD and GSEF) increased by 2.4 points to 3.7%.
- Other non-MRO entities’ shares totaled 0.3% and were individually flat YoY.
- Of D2D platform EUR FRAs notional volume, $13.5 trillion or 86% were from MRO of which Trads MRO took 14.9 points at the expense of OSTTRA Reset (down 8.9 points) and Matchbook (down 6.6 points).
D2D platform shares of non-EUR FRAs
All except DKK of the six other FRA currencies mentioned in Background showed D2D platform spike day patterns in Q2. SDRView users can pull the chart using the Rates Custom View tab, setting the Q2 start and end, FRA, the currency, platform type D2D, rows to date, columns to platform id.
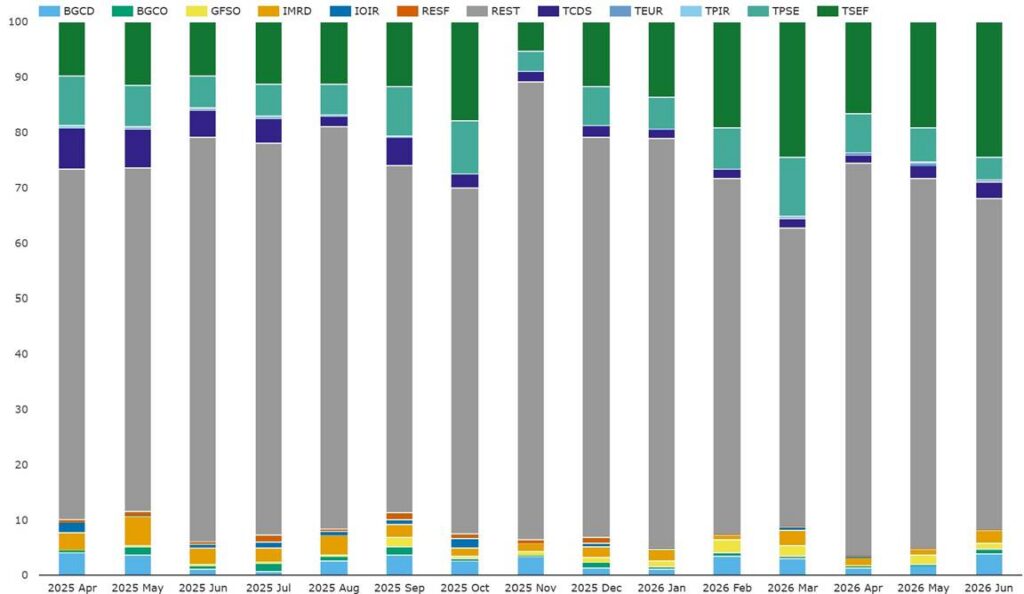
Chart 3: D2D platform SEK, NOK, CZK, PLN, and HUF FRA platform shares (percentage of USD notional). Source: SDRView
Chart 3 plots the five currencies D2D platform FRA shares by month across the five quarters from Q2 2025 to Q2 2026. The aggregated underlying notional volumes can be used to compare the platform shares YoY between Q2 2025 and Q2 2026:
- OSTTRA Reset declined by 0.5 points to 66.4%.
- Tulletts’ TPSE entity declined by 1.8 points to 5.9% of which 1.6 points was Matchbook activity.
- Trads’ share increased by 9.7 points to 19.8% of which 13.6 points was MRO activity.
- Other D2D platforms reset hedging activity declined in share by 7.4 points to 7.9% – mainly in Tulletts entities (net down 4.2 points) and ICAP entities (net down 2.9 points).
Of D2D platform SEK, NOK, CZK, PLN, and HUF FRAs notional volume, $498 billion or 82% were from MRO of which Trads MRO took 13.6 points at the expense of Matchbook (down 1.8 points) and bilateral reset-hedging on Tulletts entities (down 4.2 points) and ICAP entities (down 2.9 points).
D2D platform shares of SPS
To distinguish SPS from other fixed-float interest rate swaps, we set the SDRView created field “subtype” to SPS (while CCPView and SEFView cannot make this distinction).
All three of AUD, NZD and ZAR produced platform spike patterns in Q2 2026. SDRView users can do this with a similar approach to other FRA currencies above. Just change product to IRSwap:FixedFloat, the currencies to the three above, and subtype to SPS.
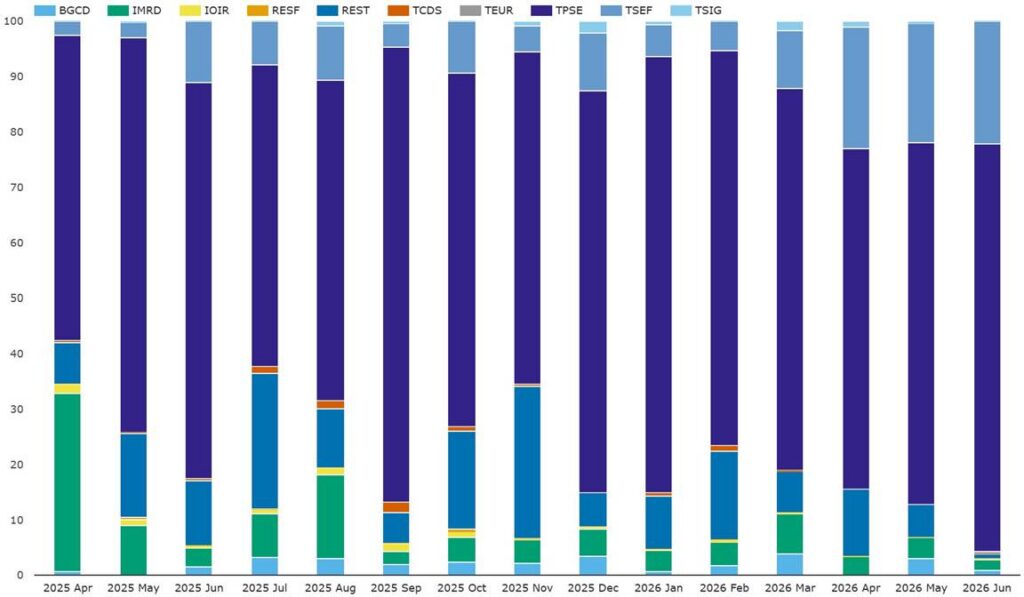
Chart 4: D2D platform AUD, NZD and ZAR SPS platform shares (percentage of USD notional). Source: SDRView
Chart 4 plots the five currencies D2D platform SPS shares by month across the five quarters from Q2 2025 to Q2 2026. The aggregated underlying notional volumes can be used to compare the platform shares YoY between Q2 2025 and Q2 2026:
- Tulletts’ TPSE entity (almost all Matchbook) declined by 2.0 points to 67.0%.
- Trads’ TSEF entity (almost all MRO) increased by 16.0 points to 22.0%.
- OSTTRA Reset declined by 6.6 points to 6.4%.
- Other D2D platforms reset hedging activity declined in share by 7.5 points to 4.6% – mainly in ICAP entities (net down 8.1 points).
Of D2D platform AUD, NZD, and ZAR SPS notional volume, $978 billion or 95% were from MRO of which Trads MRO took 22.0 points at the expense of Reset (down 6.6 points), Matchbook (down 2.0 points), and bilateral reset-hedging on ICAP entities (down 8.1 points).
End note
Four charts gave us an overview of Q2 D2D platform reset hedging activity, but this use is only the tip of the iceberg of data and reporting features in SDRView. Click the link for more details, or contact us for a demonstration.
Skip back to the top to re-read the key takeaways if you like.