
This blog is the Q2 2026 edition of our quarterly blog on US-reported OTC equity derivatives volumes. We expand the focus from the inaugural Q1 edition to cover equities total return swaps (TRS) in the top six currencies – USD, EUR, CNY and HKD combined, JPY, and GBP – which were 91% of the Q2 volume.
Key takeaways
Q2 2026 total SBSDR-reported notional volumes of equity TRS were as follows:
- USD TRS were up 134% year-on-year (YoY) to $4.25 trillion.
- EUR TRS were up 51% YoY to $986 billion.
- Chinese currencies TRS (CNY and HKD combined) were up 148% YoY to $648 billion.
- JPY TRS were up 96% YoY to $555 billion.
- GBP TRS were up 63% YoY to $460 billion.
Read on for the charts and tables created in SBSDRView which collects data from US security-based swap data repositories (SBSDRs) which capture trades reported by participants according to US SEC regulation.
Discussion of focus
To consider the focus of this blog, I broke down Q2 2026 EQD volumes by product type and subtype.
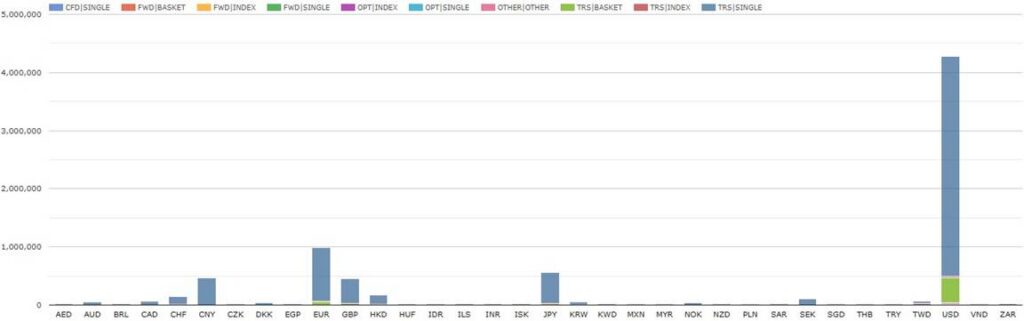
Chart 1: Q2 2026 US-reported EQD volumes by currency, product type, and subtype (notional USD millions). Source: SBSDRView
Chart 1 illustrates that the total $7.58 trillion notional volume of Q2 2026 US-reported EQD broke down as follows:
- Non-TRS products made up the other 0.8% of the total – almost invisible in the chart but including contracts for difference (CFDs), options (OPT), forwards (FWD) and other (OTHER).
- TRS dominated with 99.2% of the total – comprising 91.2% single-names, 7.1% custom baskets (henceforth referred to as baskets), and 0.9% indexes.
- Of the total, TRS in the top six currencies were 90.8% – comprising 56.0% USD, 13.0% EUR, 7.3% JPY, 6.2% CNY, 6.1% GBP, and 2.2% HKD.
- Of the total, TRS in the next eight currencies were 7.4% – CHF, SEK, CAD, TWD, KRW, AUD, DKK, and NOK.
- Of the total, TRS in the remaining 20 currencies had 1.0% of the total.
- After digging through leading listed Chinese companies names for the Q1 edition, it was clear that several leading Chinese companies list in HKD on HKEx rather than in CNY on mainland exchanges. This time therefore I include HKD and combine it with CNY as “Chinese currencies TRS” which is now the third largest “currency group” with 8.4%.
- Keep in mind: US SBSDRs are limited to trades with a US party on one or both sides. The fraction of global TRS volumes involving US investors or dealers may be smaller for Asian currencies than for Americas or European currencies. Therefore, JPY, CNY, and HKD may be underrepresented by the percentage shares above.
- We limit the remainder of the blog to TRS in the top six currencies.
USD TRS
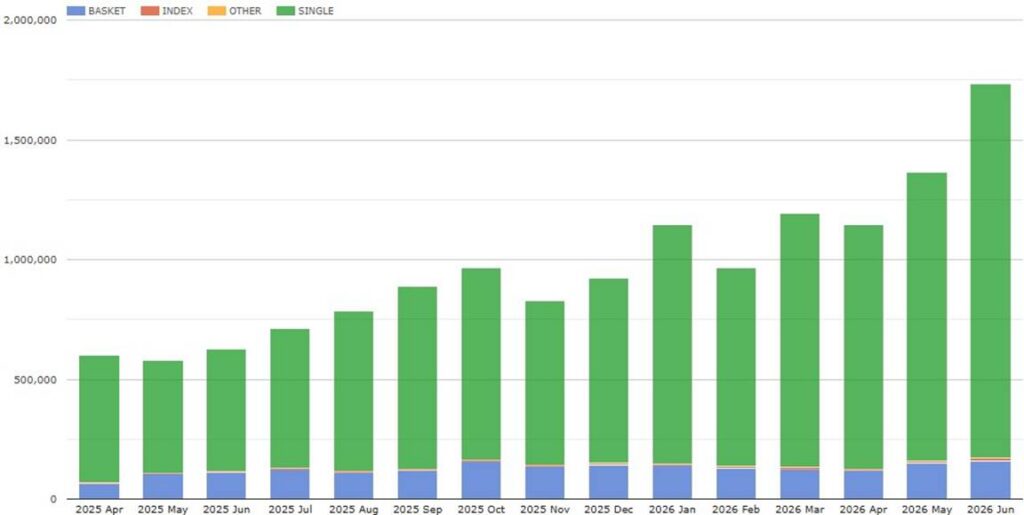
Chart 2: US-reported USD TRS volumes by subtype (notional USD millions). Source: SBSDRView
Chart 2 illustrates the breakdown by month of the total USD TRS volume in Q2 2026 of $4.25 trillion, a new record quarter – up 134% YoY and up 28% from the Q1 2026 prior high of $3.31 trillion.
- Single-name TRS volumes were up 150% YoY while basket TRS volumes were up by 50% YoY.
- Each of May with $1.37 trillion and June with $1.73 trillion were new monthly highs – up from the March 2026 prior high of $1.19 trillion.
Now for the top 10 names in March and June.
Top 10 most actively traded names on USD single-name and basket TRS (ranked by USD notional). Source: SBSDRView
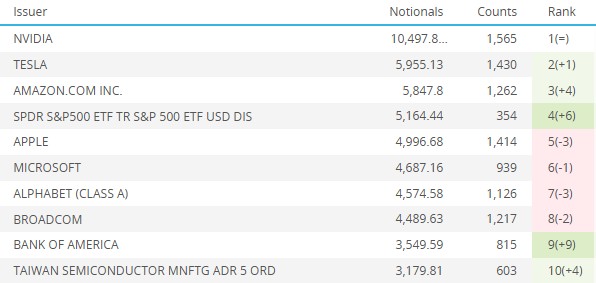
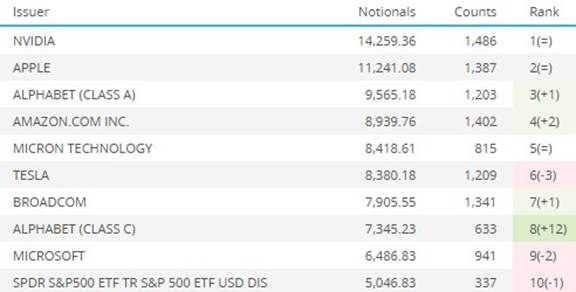
Table 1: March 2026 Table 2: June 2026
As usual, the June 2026 USD top 10 list is dominated by semi-conductors, Tesla, big tech, and the S&P 500 index ETF. Eight of the March list featured in the June list where Micron and Alphabet (Class C) replaced Bank of America and Taiwan Semiconductor.
EUR TRS
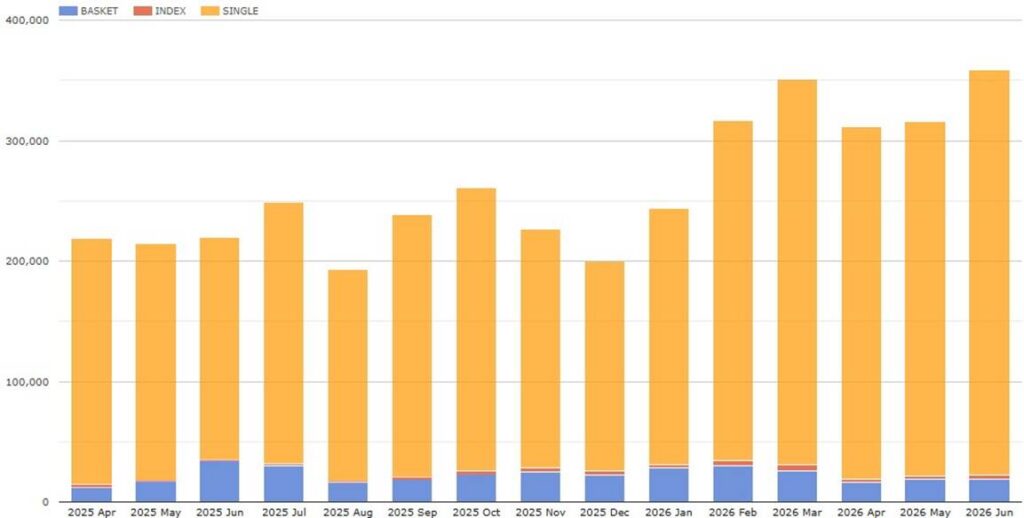
Chart 3: US-reported EUR TRS volumes by subtype (notional USD millions). Source: SBSDRView
Chart 3 illustrates the breakdown by month of the total EUR TRS volume in Q2 2026 of a record $986 billion – up 51% YoY and up 8.2% from the Q1 2026 prior high of $912 billion.
- Single-name TRS volumes were up 13% quarter-on-quarter (QoQ) while basket TRS and index TRS both declined in volume by 30+% QoQ.
- June with $359 billion was a new monthly high – up 2.2% from the March 2026 prior high of $351 billion.
Now for the top 10 names in March and June.
Top 10 most actively traded names on EUR single-name and basket TRS (ranked by USD notional). Source: SBSDRView
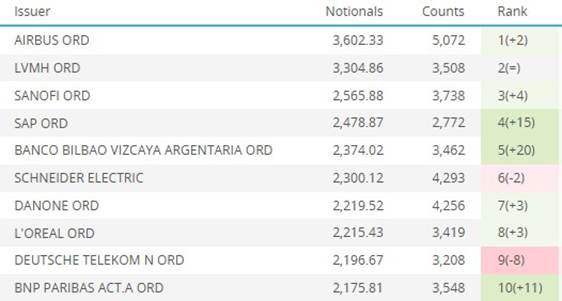
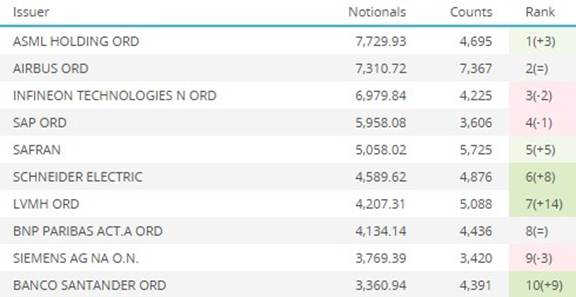
Table 3: March 2026 Table 4: June 2026
Few tech companies made the EUR top 10. Five of the March list featured in the June list where ASML, Infineon, Safran, Siemens and Banco Santander replaced Sanofi, BBVA, Danone, L’Oreal, and Deutsche Telekom.
Chinese currencies TRS (CNY and HKD combined)
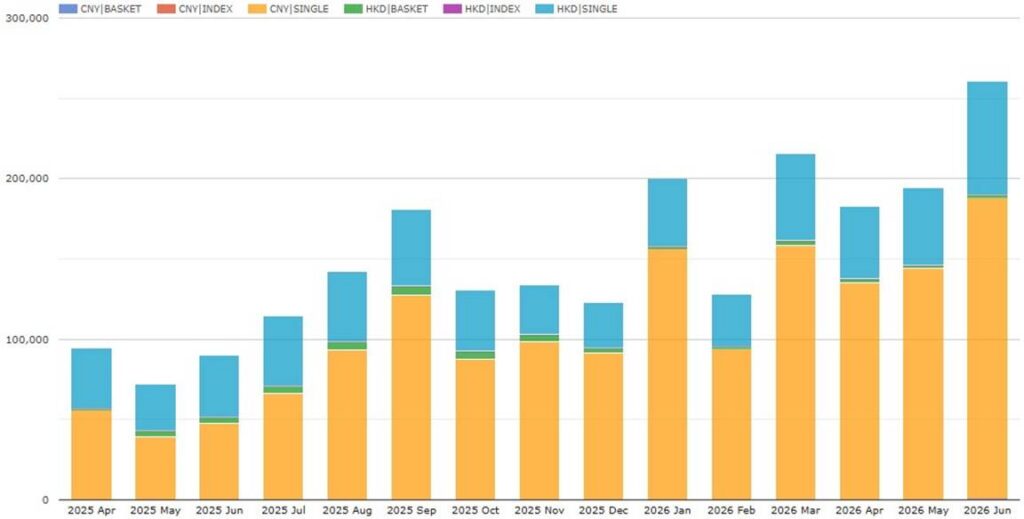
Chart 4: US-reported Chinese currencies TRS volumes by currency and subtype (notional USD millions). Source: SBSDRView
Chart 4 illustrates the breakdown by month of the total Chinese currencies TRS volume in Q2 2026 of a record $638 billion – up 148% YoY and up 17% from the Q1 2026 prior high of $544 billion. (By the way: Chinese currencies TRS overtook JPY in quarterly volume for the first time in Q3 2025.)
- Single-name TRS volumes and basket TRS volumes were each up 17% QoQ.
- June with $261 billion was a new monthly high – up 21% from the March 2026 prior high of $216 billion.
JPY TRS
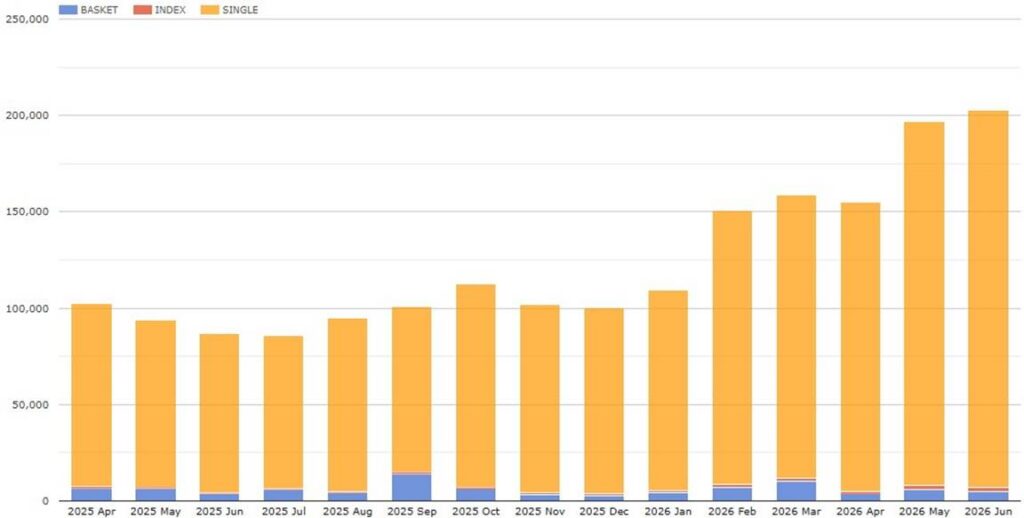
Chart 5: US-reported JPY TRS volumes by subtype (notional USD millions). Source: SBSDRView
Chart 5 illustrates the breakdown by month of the total JPY TRS volume in Q2 2026 of a record $555 billion – up 96% YoY and up 32% from the Q1 2026 prior high of $419 billion.
- Single-name TRS volumes and index TRS volumes each grew by over 33% QoQ while basket TRS volumes declined by 32% QoQ.
- May with $197 billion and June with $203 billion were consecutive new monthly highs – up from the March 2026 prior high of $159 billion.
Now for the top 10 names in March and June.
Top 10 most actively traded names on EUR single-name and basket TRS (ranked by USD notional). Source: SBSDRView
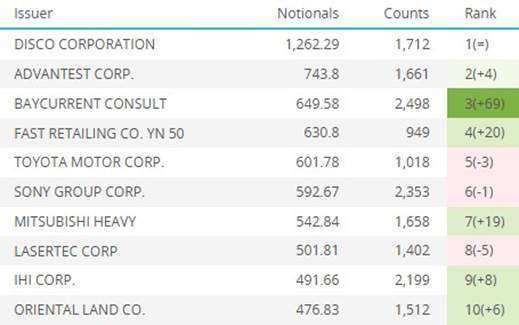
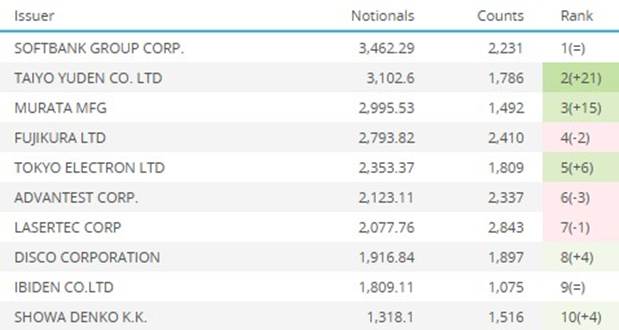
Table 5: March 2026 Table 6: June 2026
Softbank wholly or partly owns tech companies and all the remaining nine except Showa Denko in the June list are semiconductor or electrical equipment and parts manufacturing companies. Only Disco, Advantest and Lasertec made both lists while the other seven in the June list replaced seven other companies in the March 2026 list.
GBP TRS
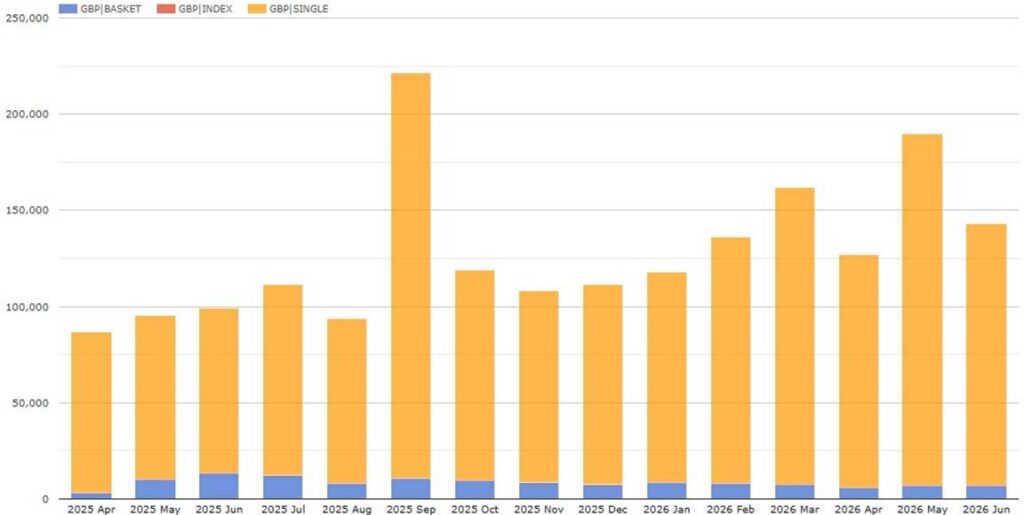
Chart 6: US-reported GBP TRS volumes by subtype (notional USD millions). Source: SBSDRView
Chart 6 illustrates the breakdown by month of the total GBP TRS volume in Q2 2026 of a record $460 billion – up 63% YoY and up 7.8% from the Q3 2025 prior high of $427 billion.
- Single-name TRS volumes were up 12% QoQ while basket TRS volumes declined by 17% QoQ.
- Each of the three months in Q2 was comfortably below the September 2025 highest ever month of $221 billion.
Now for the top 10 in March and June.
Top 10 most actively traded names on GBP single-name and basket TRS (ranked by USD notional). Source: SBSDRView
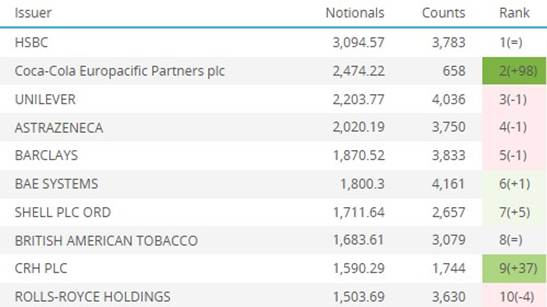
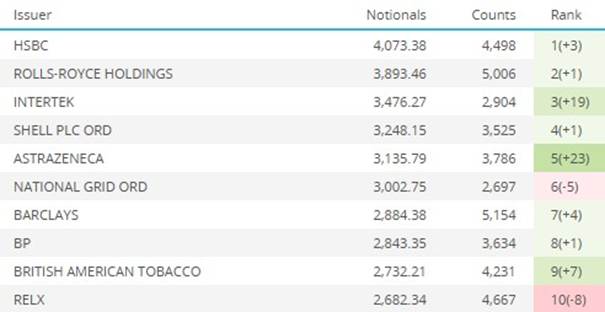
Table 7: March 2026 Table 8: June 2026
The GBP top 10 also contained few tech companies. Six of the March list featured in the June list. National Grid, BP, Intertek – an AI testing company, and RELX – a decision-making tools and compliance management firm replacing Coca-Cola Europacific Partners, Unilever, BAE Systems, and CRH.
End note
Six charts and eight tables gave us an overview of Q2 volumes in Equity TRS, but there is a lot more data in SBSDRView. Click the link for more details, or contact us for a demonstration.
Skip back to the top to re-read the key takeaways if you like.