
This blog looks at Q3 2026 volumes of FX derivatives (FXD), following the record volumes noted in the Q2 edition.
Key takeaways
Q3 2026 FXD volumes were a mixed bag:
- NDFs were up 8.6% from their Q2 cleared record and up 5.6% from their Q2 US-reported record.
- Roughly two fifths of global NDFs cleared.
- Cleared spot FX almost doubled to set another cleared record.
- FX options were down 14% from their Q2 cleared record and down 15% from their Q1 US-reported record while USDJPY, EURHUF and EURMXN reached new highs.
- About one tenth of global FX options cleared.
- Cleared FX forwards were down 14% from their Q2 cleared record.
Read on for more analysis, explanation and volume charts and statistics from CCPView and SDRView.
Cleared FXD volumes
We look at cleared FXD by product type: NDFs, FX options, FX forwards, NDOs, and spot.
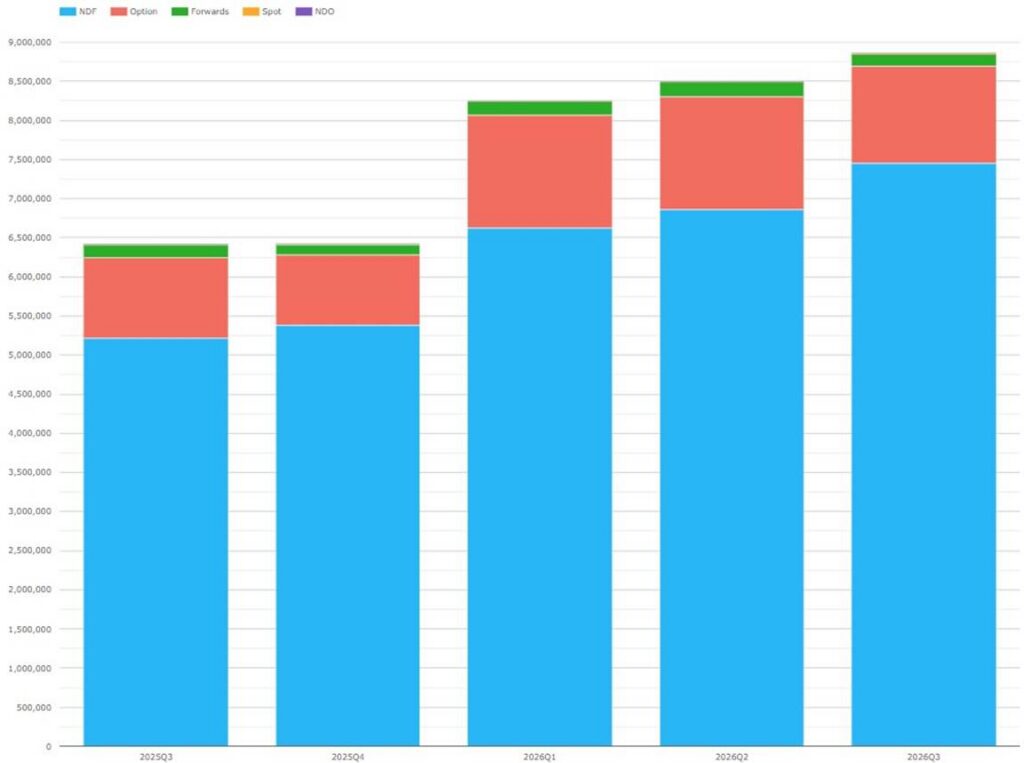
Chart 1: Cleared FXD by product (notional US$ millions). Source: CCPView
Chart 1 shows that Q3 cleared FXD volumes were US$8.86 trillion, a new record – up 38% YoY and up 4.3% from the Q2 record of US$8.50 trillion.
- NDFs were by far the largest with US$7.45 trillion – up 43% YoY and up 8.6% from the Q2 record.
- FX options were next largest with US$1.24 trillion – up 20% YoY but down 14% from the Q2 record.
- FX forwards were US$158 billion – down 2.2% YoY and down 14% from the Q2 record.
- Spot FX was US$13.5 billion – up 3.3x YoY and up 90% from the Q2 record.
- NDOs were US$3.53 billion – down 44% YoY and well below the Q1 record.
The fast growth of cleared spot FX indicates activity to optimize clearing account margin and CLS settlement limit usage arising from cleared forwards or FX option exercises, given there is a margin disincentive to clear spot FX outright.
The rest of this blog digs further into the volumes of NDFs and FX options.
NDFs
We start with a currency breakdown of cleared NDFS.
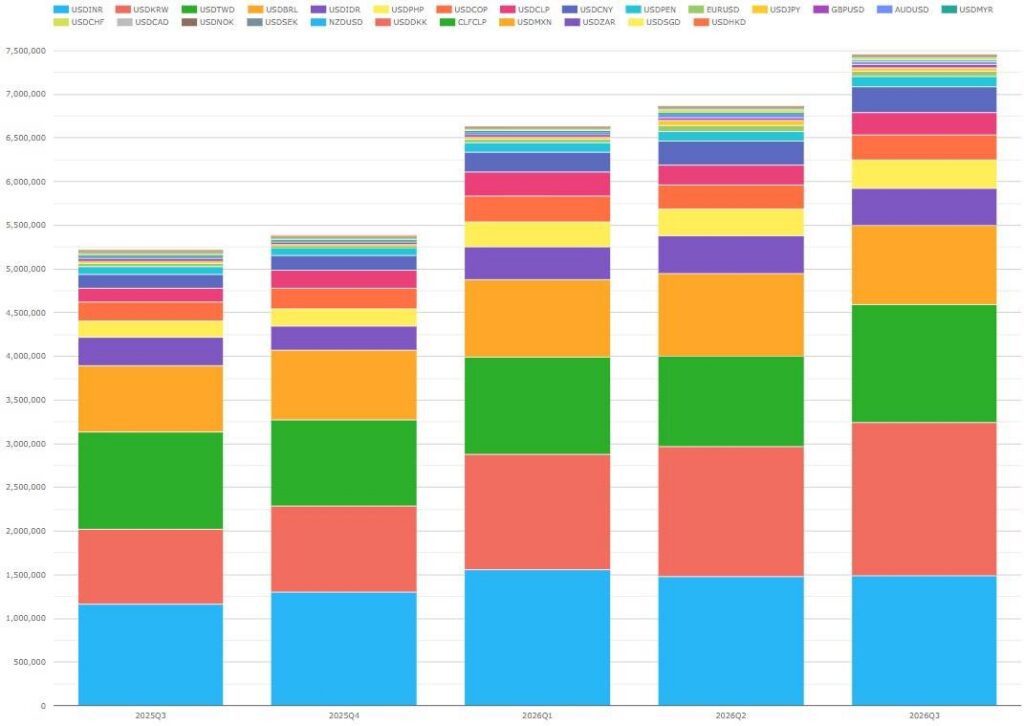
Chart 2: Cleared NDFs (notional US$ millions). Source: CCPView
Chart 2 breaks down by currency the US$7.45 trillion of Q3 NDF volumes in Chart 1, 97.1% of which came from the twelve non-deliverable currency pairs with had a combined US$7.23 trillion – up 43% YoY and up 9.4% QoQ. We highlight the top seven pairs which were 88% of Q3 volume.
- KRW continued to lead with US$1.76 trillion – up 104% YoY and up 18% from the Q2 record of US$1.49 trillion.
- INR was next with US$1.487 trillion – up 28% YoY but down 4.6% from the Q2 record.
- TWD saw US$1.35 trillion – up 21% YoY and up 21% from the Q1 record.
- BRL had US$910 billion – up 21% YoY but down 3.9% from the Q2 record.
- IDR cleared US$419 billion – up 28% YoY but down 2.4% from the Q2 record.
- PHP showed US$330 billion – up 73% YoY and up 8.2% from the Q2 record.
- CNY was US$298 billion – up 90% YoY and up 10% from the Q2 record.
Deliverable currencies made up the remaining 2.9% of the volumes with US$214 billion – up 23% YoY but down 14% QoQ from the Q2 record of US$247 billion. This may reflect the declines below in FX options trading which generate the uncleared deliverable pair FX delta which FX IM optimization vendors offset with deliverable pair NDFs.
Looking at CCP market share, LCH ForexClear continued to dominate cleared NDFs with a share of 99.44% in Q3 – up YoY from 99.29% and up QoQ from 99.41%, at the expense of both ComDer and CME.
Now, we look at US-reported NDFs – limiting to the top 30 pairs which consistently make up 99.3% of volumes.
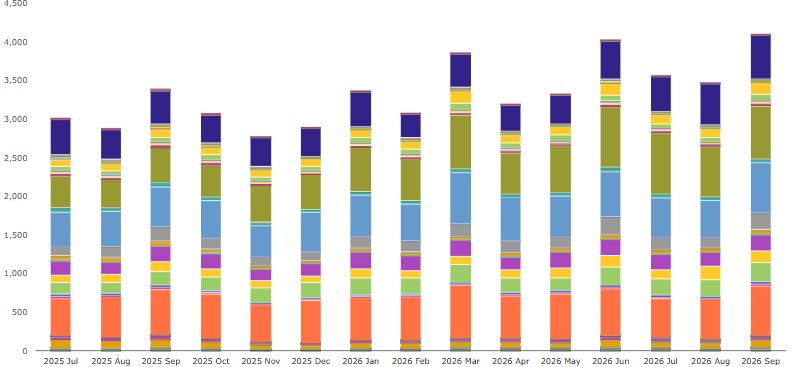
Chart 3: US-reported NDF volumes in the top 30 currency pairs (notional US$ billions). Source: SDRView
Chart 3 illustrates the record Q3 volumes in the top 30 pairs of US$11.1 trillion (which was 99% of all NDFs) – up 20% YoY and up 5.6% from their Q2 record of US$10.5 trillion.
NDFs on the top 14 non-deliverable pairs were US$9.96 trillion (89% of all NDFs) – up 27% YoY and up 6.0% from their Q2 record of US$9.39 trillion. I highlight the top four currencies (62% of all NDFs) plus CNY.
- KRW (in khaki green) had the largest volume with US$2.14 trillion – up 75% YoY and up 11% from the Q2 high.
- BRL (in dark orange) was second with US$1.66 trillion – up 4.9% YoY but down 4.8% QoQ.
- INR (in light blue) was next at US$1.64 trillion – up 16% YoY but down 2.2% QoQ.
- TWD (in dark blue) saw US$1.55 trillion – up 22% YoY from the Q3 2025 high.
- CNY (in dark yellow) had US$443 billion – up 35% YoY and up 15% from the Q2 high. CNY was eighth in volume.
The top 16 deliverable pairs made up our top 30 and had US$1.10 trillion (10% of all NDFs) – down 19% YoY from the Q3 2025 record of US$1.36 trillion.
Estimating the Q3 cleared fraction for NDFs, we have 7.45 / (8.86 x 2) = 42.0% up from 32.6% in Q2.
FX options
Moving onto FX options, cleared volumes break down as follows.
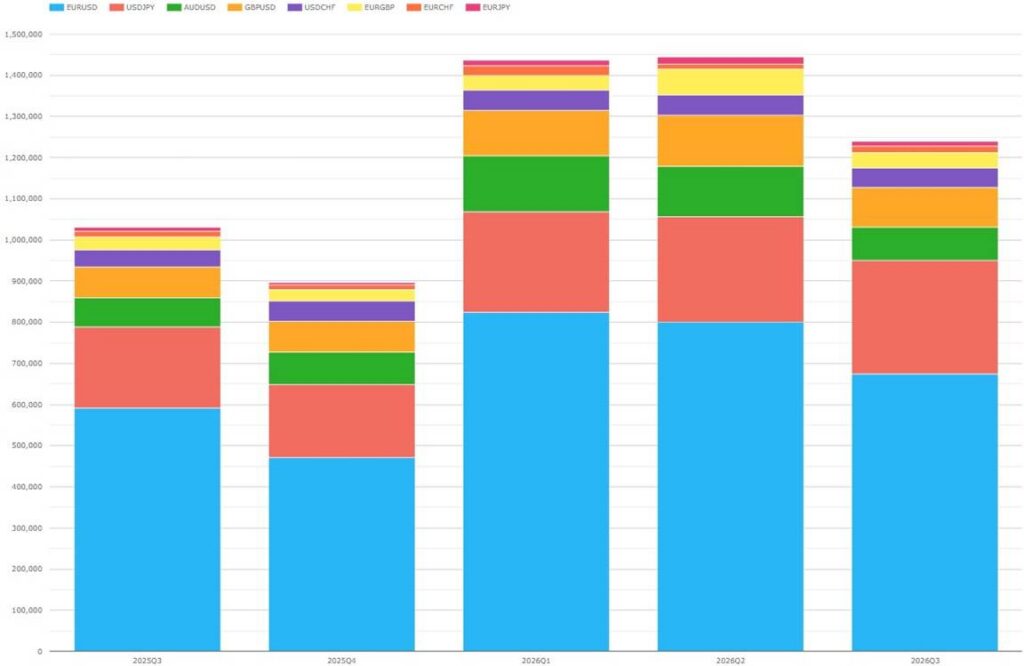
Chart 4: Cleared FX options (notional US$ millions). Source: CCPView
Chart 4 breaks down by currency pair the $1.24 trillion of Q3 FX options in Chart 1. All cleared FX options cleared at LCH ForexClear.
Trades versus USD totaled $1.17 trillion (94.7% of cleared FX options) – up 20% YoY but down 14% from the Q1 record of $1.36 trillion.
- EUR was by far the largest at US$673 billion – up 14% YoY but down 18% from the Q1 record.
- JPY was next at US$276 billion – up 40% YoY and up 7.9% from the Q2 record.
- GBP was third with US$97.7 billion – up 30% YoY but down 21% from the Q2 record.
- AUD was next with US$81.2 billion – up 13% YoY but down 40% from the Q1 record.
- CHF had US46.0 billion – up 11% YoY but down 9.0% from the Q4 2025 record.
The remaining US$65.8 billion came from EUR crosses versus GBP, JPY, or CHF – up 22% YoY but down 30% from the Q2 record.
In summary, Q3 currency-level cleared FX options volumes were well below highs set in Q1 or Q2 2026, except for JPY, which reached a new record.
Now, we look at US-reported vanilla FX options – limiting currency pairs to the top 15 with over US$60 million SDR-reported Q3 volume, which meant 11 pairs versus USD and 4 versus EUR.
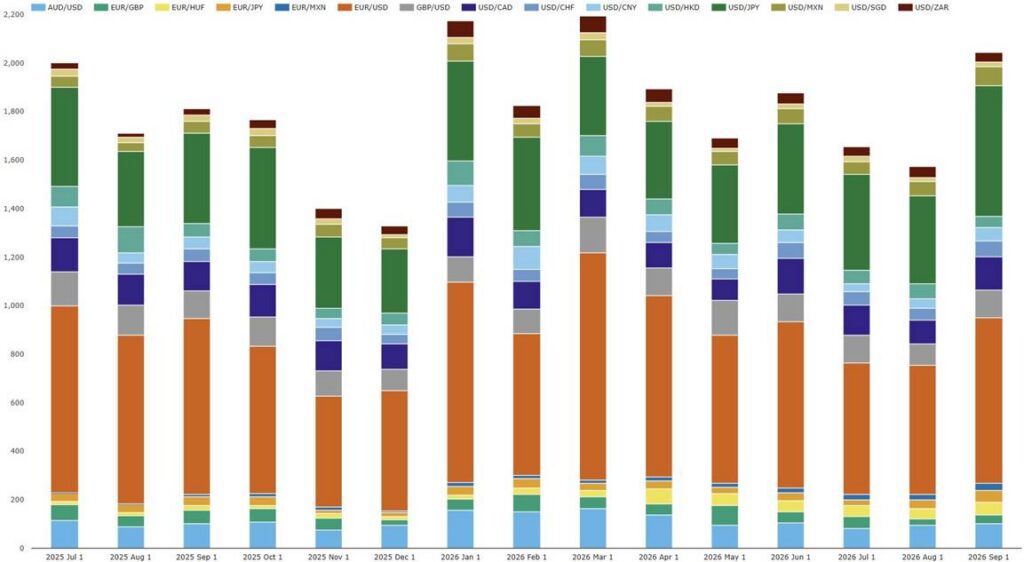
Chart 5: US-reported FX options in 15 selected pairs (notional US$ billions). Source: SDRView
Chart 5 illustrates that Q3 US-reported FX options volumes in those 15 pairs were US$5.27 trillion (89% of the all-pairs total of US$5.95 trillion) – down 4.5% YoY and down 15% from the Q1 record of US$7.02 trillion. 121 other pairs made up the remaining US$675 billion.
The top 11 pairs versus USD totaled US$4.84 trillion – down 6.8% YoY and down 17% from their Q1 record of US$5.81 trillion. We highlight the major currencies plus CHF and CNY.
- EUR was the largest at US$1.76 trillion – down 20% YoY and down 25% from the Q1 record.
- JPY was next at US$1.29 trillion – up 19% YoY and up 15% from the Q1 record.
- CAD had US$357 billion – down 8.4% YoY but up 5.4% QoQ.
- GBP slipped below CAD with US$318 billion – down 16% YoY.
- AUD was next at US$279 billion – down 6.9% YoY.
- CHF was an exception with US$172 billion – up 17% YoY and up 2.4% from the Q1 record.
- CNY was next at US$123 billion – down 27% YoY and ninth in volume.
The top four EUR crosses had volume of US$432 billion – up 30% YoY but down 9.0% from their Q2 record of US$475 billion. The leading pairs in volume order were EUR versus HUF, GBP, JPY, and MXN, with EURJPY and EURMXN reaching new highs.
In summary, Q3 currency-level US-reported FX options volumes were well below highs set in Q1 or Q2 2026. Among the top 15 pairs, only USDJPY, EURCHF, and EURMXN reached new records.
Estimating the Q3 cleared fraction for FX options, we have 1.24 / (5.95 x 2) = 10.4%, down from 11.9% in Q2.
Note on volume statistics
Cleared FX OTC derivatives covered by CCPView include NDFs, FX options, FX forwards, NDOs, and spot FX and are globally complete.
FX derivatives covered by SDRView include the mandated option, non-deliverable, and exotic products while deliverable spot and forward trades not usually reported. NDFs and vanilla options commonly dominate volumes.
SDR-reporting includes trades where a US party is on one or both sides. SDRView thus omits roughly half the global total while still providing a good guide to global volume dynamics over time.
Trades reported to SDRs as “uncleared” may in fact be cleared post-trade. Instead, we “guesstimate” FXD product clearing rates by dividing the CCPView cleared totals by double the SDR-reported volumes.
That’s it
We used five charts to cover OTC FXD volumes.
You can find a lot more data in CCPView and SDRView.
Contact us if you’re interested in a subscription.