- Clarus CCPView provides insight into volumes across Swaps, Bonds and Futures.
- We look at the evolution of volumes in different parts of the yield curve.
- H2 2021 saw some extremely large volumes, with certain tenors showing more activity than in March 2020.
- Are these elevated volumes here to stay?
CCPView includes volumes covering Swaps (OTC Derivatives), Cash Bonds (USTs) and Futures (Exchange Traded Derivatives, ETDs). That means it provides a one-stop shop for all your Rates trading needs, showing volumes across the three major product types.
With Q2 2021 just finished and yet the turbulence of the trading conditions in both Q1 2020 and Q1 2021 still fresh in the mind, I thought it would be interesting to look at overall Rates markets volumes.
We can’t promise to tell you what volumes are going to do in the future, but we can at least provide a decent analysis of what they’ve done in the recent past.
Monthly Volumes in USD Long Rates
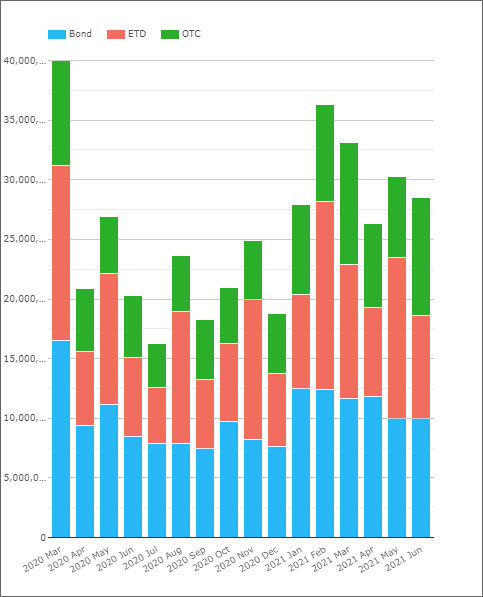
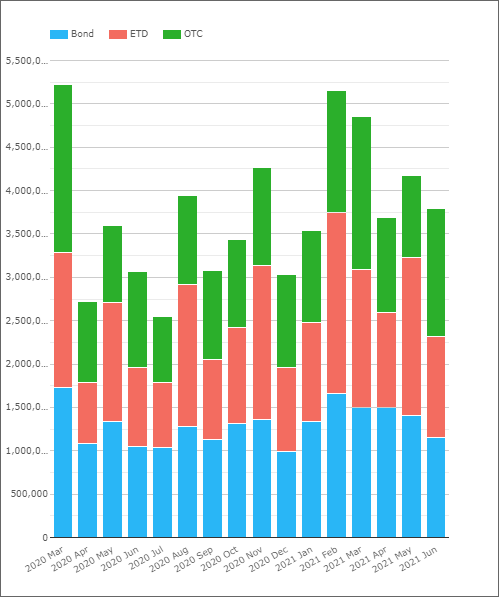
First stop, the monthly volumes:
- The chart shows volumes in Swaps, Futures and USTs across all tenors. The goal is to look at liquid instruments that are involved in risk transfer.
- For the sake of completeness, it excludes FRAs, OIS, Basis swaps and all STIRs. It also excludes Treasury bills and any inflation-linked products. That is a big list of exclusions but also highlights how broad our data reach is getting. For our users, it is saved as preset “USD Long Rates” in CCPView.
- The chart shows what an unusual month March 2020 was in terms of volumes traded. Those total amounts have not been reached since (although we have come close at the long-end). March 2020 was also the first month that the US Treasury started to make transparency data available for UST trading.
- The total trading volumes for these instruments are anywhere between $20 Trn and $40 Trn notional equivalents per month.
- These past six months have seen larger traded volumes than any month in 2020 except March and May.
- Volumes in Q2 2021 have been about 12% lower than in Q1 2021.
- However, volumes in H1 2021 have been an incredible 48% higher than in H2 2020!
- Average monthly volumes in 2021 are 42% higher than the average monthly volumes in 2020 (excluding March 2020).
Volumes by Product
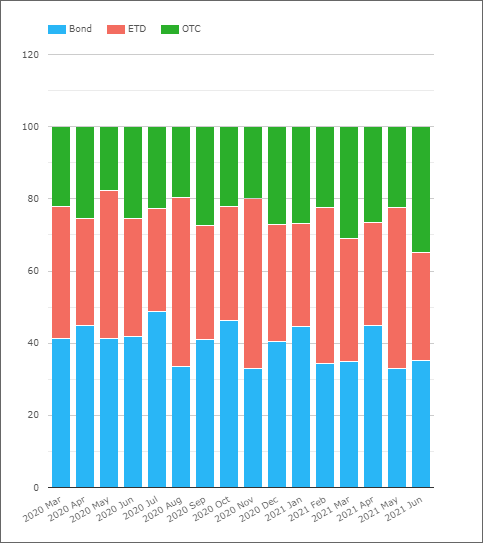
For those interested in market structure, and potentially where the deepest pool of liquidity lies for risk transfer, it is somewhat interesting to look at the amounts traded across each product:
Showing;
- In 2020, 41% of notional was traded as a cash bond (UST). 36% of notional equivalents were traded as an exchange traded bond future with 23% as an OTC product.
- In 2021, OTC products have gained “market share” to now represent 27% of the market. This has come at the expense of cash bonds (USTs), which have dropped to 38% of the market.
- Not big moves, but potentially worth monitoring.
I examined this split in more detail in an earlier blog post for those interested:
This earlier blog found that
- Cash bonds are the largest component of volumes, accounting for 45% of notional.
- Bond Futures account for 33%, and Interest Rate Swaps the remainder.
- Looking at the maturity profile, 10Y and 30Y tenors see by far the most amount of risk transacted.
- These two tenors alone account for 65% of activity on a risk-adjusted basis.
CCPView users can of course repeat this analysis at any time!
Volumes by Maturity
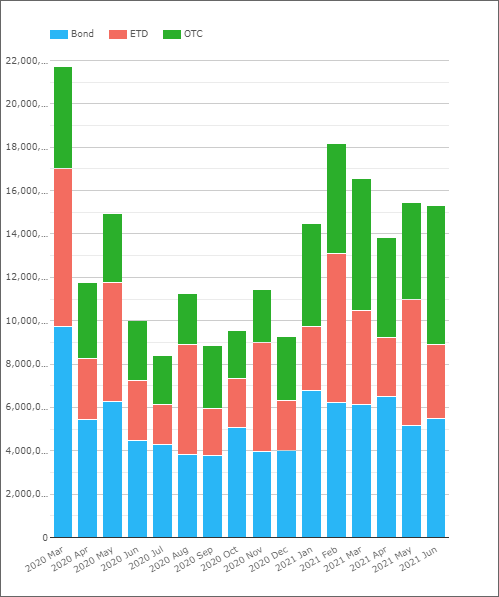
Moving back to our most recent data again, we take a look first at volumes with maturities up to 5Y only. This shows a very similar chart to the overall monthly volumes:
Showing;
- Volumes have ranged from just below $14Trn to over $18Trn notional equivalents in the past six months.
- Again, these volumes are considerably higher than H2 2020, with only May 2020 and March 2020 getting close to those volumes.
- Average monthly volumes in these tenors for 2021 are 47% higher than average monthly volumes were in 2020 (excluding March 2020).
If we now move on to look at the 6Y-10Y area of the curve, we see huge volumes in 2021;
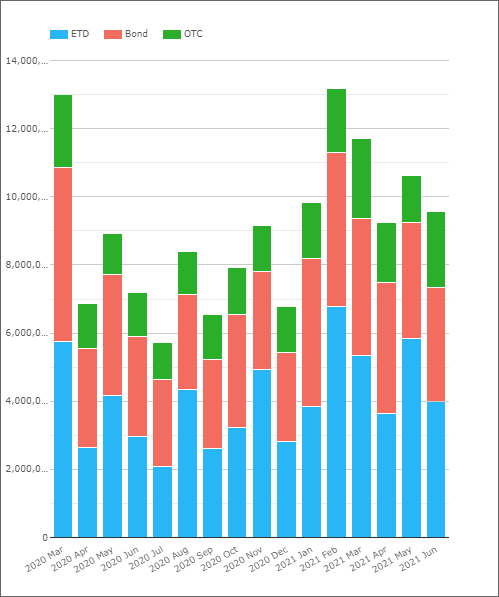
This shows elevated volumes in Q1 2021. 10Y volumes were higher in February 2021 than even March 2020. Each of the months since, except April, have also been marked by exceptional levels of activity in the 10Y area of the curve. Most months this year have seen $10Trn to $13Trn notional equivalents trade in these maturities.
- 2021 average monthly volumes in the 6Y-10Y area of the curve have been 43% higher than 2020 average monthly volumes (excluding March 2020).
The 10Y activity is only somewhat reflective of the long end of the curve. In maturities 10Y+, we have seen large activity in 2021, but….
- Monthly volumes in 2021 have been only 27% higher in 10Y+ tenors than the 2020 monthly average (excluding March 2020).
Short End Volumes
Trading activity in 2021 has been robust, and volumes have been well above the second half of 2020 for the longer part of the curve. However, what about all of those instruments I previously excluded from the charts?
Let’s look at FRAs, OIS, Swaps up to 2Y maturities:
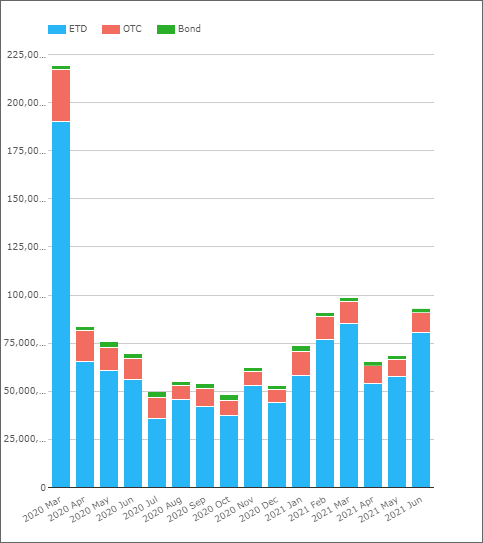
Showing;
- The volumes back in March 2020 were truly extraordinary at the short end of the curve.
- This was mainly driven by huge volumes in eurodollar futures at CME.
- The huge spike back in March last year distorts this chart more than the others.
- Monthly volumes in 2021 have been 34% higher than monthly volumes in 2020 (excluding March 2020).
The growth in short-dated products has therefore somewhat lagged the growth we saw in volumes up to 10Y (which have been 43-47% higher since March last year). Still, 34% growth is pretty impressive.
Inflation Volumes
Finally, following on from my blog on G3 Inflation Volumes, I thought we should look at what trading activity has been like in US Inflation specifically:
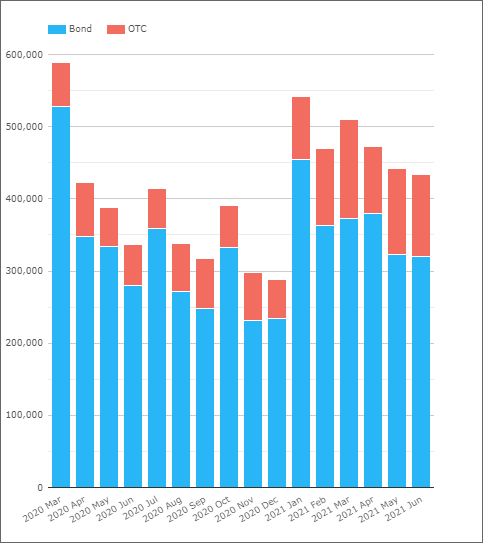
Showing;
- Volumes in the past six months outstripped every month since March 2020.
- Monthly volumes in 2021 have been 35% higher than monthly volumes in 2020 (excluding March 2020).
- This looks at inflation activity across all maturities.
In Summary
- Volumes in the 6Y-10Y area of the curve are the big story of 2021 so far.
- They have outstripped the previous monthly record set in March 2020.
- Volumes in the 5y-10y area of the curve are 43-47% higher than most of 2020 (March 2020 excluded).
- Short-end volumes, inflation and longer maturities of 10Y+ have lagged this growth, but are still running 27-35% higher than most of 2020.
- The largest volumes we have seen in 2021 were in the midst of the Fixed Income sell-off in January and February. With yields now back down to February levels again, what does that mean for trading volumes from here?
- Follow our blog, subscribe to our data products or simply get in touch to stay on top of these trends.