Clearing Houses have published their latest CPMI-IOSCO Quantitative Disclosures:
- Initial margin for ETD at $438 billion is down 2.5% QoQ and down 20% YoY
- Initial margin for IRS at $283 billion is down 11% QoQ and up 1% YoY
- Initial margin for CDS at $63 billion is down 9% QoQ and down 15% YoY
- In 3Q23 a number of CCP quantitative disclosure show record highs
- Highlighted are ASX, CCIL, CFFEX, CME, DTCC, ECC, OCC, SCH, SHFE, TAIFEX, Takasbank
- Charts and details below
Background
Under the CPMI-IOSCO Public Quantitative Disclosures, CCPs publish over two hundred quantitative data fields covering margin, default resources, credit risk, collateral, liquidity risk, back-testing and more.
CCPView has 8 years of these quarterly disclosures for 44 Clearing Houses, each with multiple Clearing Services, covering the period from 30 Sep 2015 to 30 Sep 2023. This disclosure data provides insights into trends over time at one CCP and comparisons between CCPs.
Let’s take a look at the latest disclosures.
Initial Margin for IRS
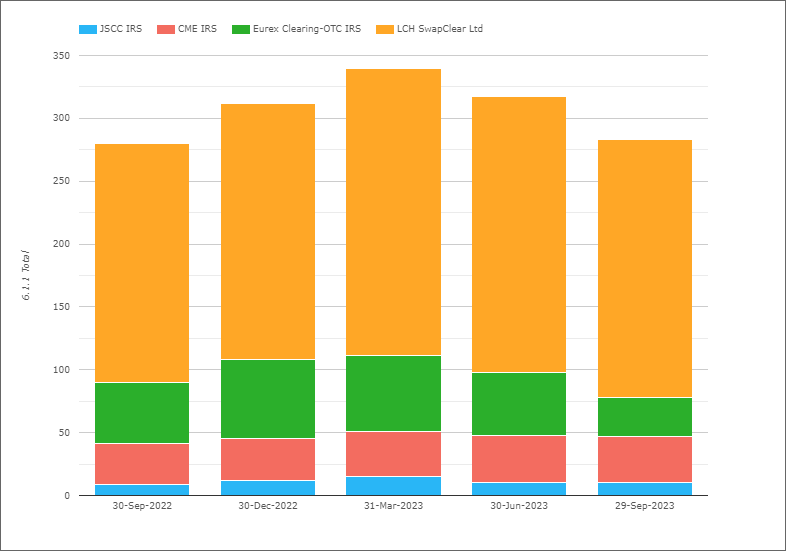
- Total IM at these four CCPs was $283 billion on 29-Sep-2023
- Down $34 billion or -11% QoQ and Up $2 billion or 1% YoY
- LCH SwapClear with $205 billion or £167 billion on 29-Sep-2023
- Down 3.5% QoQ and 3% YoY in GBP terms (Down 6% and Up 8% in USD terms)
- Eurex OTC IRS with $30.6 billion or €29 billion
- Down €17.5 billion or 38% QoQ and Down €22 billion or 43% YoY (in EUR terms)
- CME IRS with $37.5 billion, Down 0.5% QoQ and Up 15.5% YoY
- JSCC IRS with $10.2 billion or Y1,518 billion, Up 3% QoQ and Up 13% YoY (in JPY terms).
Total IM for IRS at $283 billion continues the down trend from record high on 31-Mar-2023. Every CCP is down QoQ, except for JSCC, while Eurex is down significantly more than others at -38% from the prior quarter.
Initial Margin for CDS
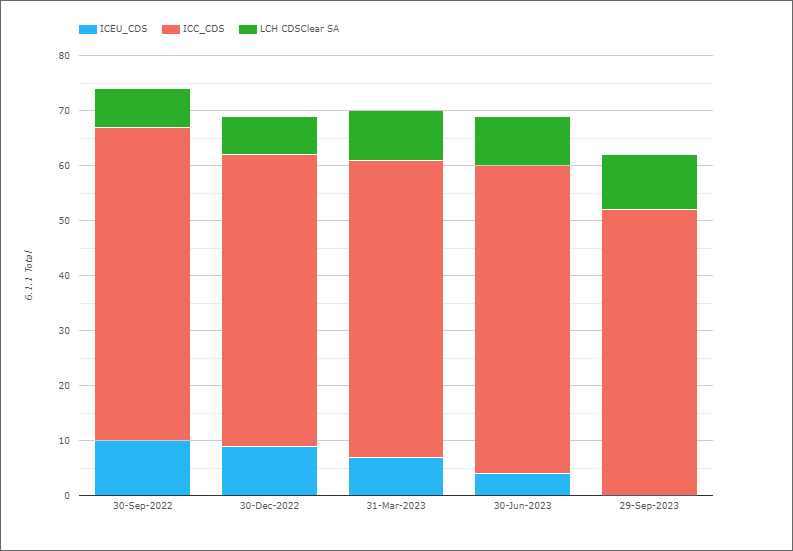
- Total IM at these three CCPs was $63 billion on 29-Sep-2023
- Down $6 billion or 9% QoQ and Down $11 billion or 15% YoY
- ICE Credit Clear with $52.4 billion
- Down $3.3 billion or 6% QoQ and Down $4.4 billion or 8% YoY
- LCH CDSClear with €9.4 billion
- Up €1.3 billion or 16% QoQ and Up €2.1 billion or 30% YoY
- ICE Europe Credit with €200 million, is down from €3.8 billion
LCH CDSClear increasing significantly QoQ and YoY, while IM at ICE Europe Credit is almost gone as it shuts down in October 2023.
Initial Margin for ETD
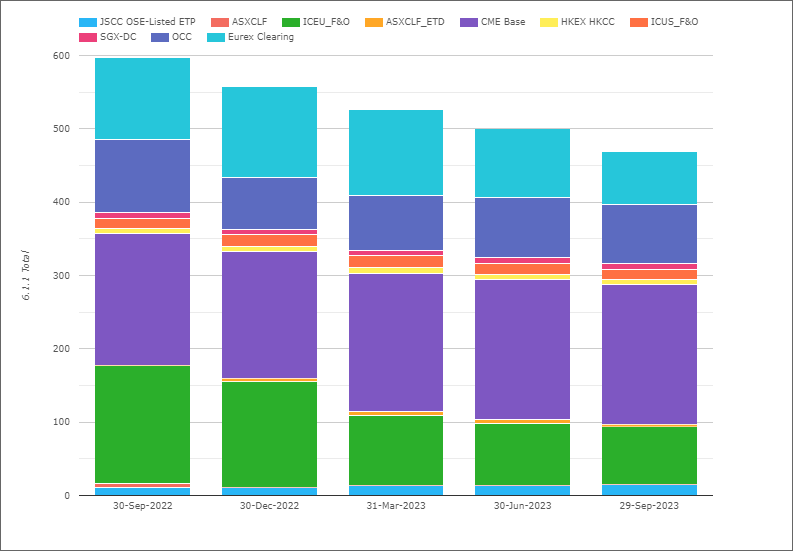
- Total IM for these CCPs was $438 billion on 29-Sep-2023
- Down $11b or 2.5% QoQ and down $109b or 20% YoY
- (Note the chart shows higher totals as Eurex includes OTC IRS IM, which I exclude)
- CME Base with $191 billion, flat QoQ and up 6% ($11b) YoY.
- ICE Europe F&O with $79 billion, down 6% ($5b) QoQ and down 51% ($82b) YoY
- OCC with $80.5 billion, flat QoQ and down 20% ($19.5b) YoY.
- Eurex with $41 billion, down 6% QoQ and down 33% ($20b) YoY.
- ICE US F&O $13.6 billion, down 11% QoQ and down 5% YoY.
- JSCC OSE Listed ETP with $15.4 billion, up 10% QoQ and Up 44% YoY
- SGX-DC $7.6 billion, down 10% QoQ and down 9% YoY
- HKEX HKCC with $6.3 billion, down 10% QoQ and down 3% YoY
- ASX CLF $3.3 billion, down 28% QoQ and down 27% YoY
IM at all CCPs is down QoQ and YoY, except for JSCC, which is up 44% YoY.
Other Disclosures of Interest
Next let’s do a quick scan of 29-Sep-23 disclosures, highlighting those with significant changes.
- ASX CLF – 6.2.15 Client IM PreHaircut, Total IM Held was $2.86 billion, down from $4.2 billion and the lowest in our historical data (from Jun-2020)
- CCIL (Clearing Corporation of India) – Rupee Derivatives (MIBOR) 6.7.1 Maximum total variation margin paid to the CCP on any given business day was $862 million, up from $303 million and the highest on record, while 6.8.1 Maximum aggregate IM call on any given business day at $2.7 billion was up from $1.3 billion, also a new high
- CFFEX (China Financial Futures Exchange) – 4.1.4 Prefunded Aggregate Participants Contributions Required were $614 million, up from $490 million and a new high
- CME Base – 6.2.5 Client IM PreHaircut held as Soverign Bonds Domestic (so UST) was $100.5 billion up from $84 billion and the highest on record
- DTCC NSCC – 4.4.3 Estimated largest stress loss (in excess of IM) from the default of any single participant, PeakDayAmount was $3 billion, up from $1.65 billion, a new high
- ECC (European Commodity Clearing) – 6.1.1 Total IM required is $13.6 billion, down from $17 billion in the prior quarter and down from the record high of $55 billion on 30-Sep-2022
- …….
- OCC – 18.4.2 Percentage of participants contributions to the default fund contributed by the largest 5 clearing members was 47%, up from 39%, the prior high being 42.65%
- SCH (Shanghai Clearing House) – Foreign Exchange – 6.5.5 Where Breaches of IM coverage have occurred, the size of the uncovered exposure, average size was $42 million, up from $38m and $25m in prior quarters
- SHFE (Shanghai Futures Exchange) – 6.2.4 Client IM PreHaircut held as unsecured cash deposited at commercial banks was $18.3 billion, up from $13.3 billion, with a prior high of $15.5 billion
- TAIFEX (Taiwan Futures Exchange) – 4.4.4 Number of days on which the estimated largest stress loss (in excess of IM) that would be caused by the default of any single participant exceeded actual pre-funded default resources was 1, and the amount in 4.4.3 shows $132 million
- Takasbank – 6.2.15 Total IM PreHaircut, Total IM Held was $4.48 billion, up from $3.9 billion
- ….. we could go on and on …..
There are a lot more Clearing Services and Disclosures but I will stop there and leave it to those of you with your own CCPView access to analyze further changes.
As well as a Web UI, we also offer an API to programatically access this data.
IOSCO Quantitative Disclosures
CCPView has disclosures from 44 Clearing Houses, each with many Clearing Services, covering Equities, Bonds, Futures, Options and OTC Derivatives with over 200 quantitative data fields each quarter and quarterly figures from September 2015 to September 2023.
If you are interested in this data, please get in touch.