- Eurex EUR market share now stands at 4-6% when measured by DV01.
- 15-30% of EUR IRS is currently executed on-SEF in the dealer to dealer market.
- 60% of EUR CRD Index volumes are on-SEF across both clients and dealers.
- EUR CRD Index trades have largely finalised their moves into ICE US and LCH European CCPs.
It all started with a blog titled “Moving Euro Clearing out of the UK: the $77bn problem?“. Now, ISDA and other trade associations have published a statement on the “active account” requirement for Europeans:
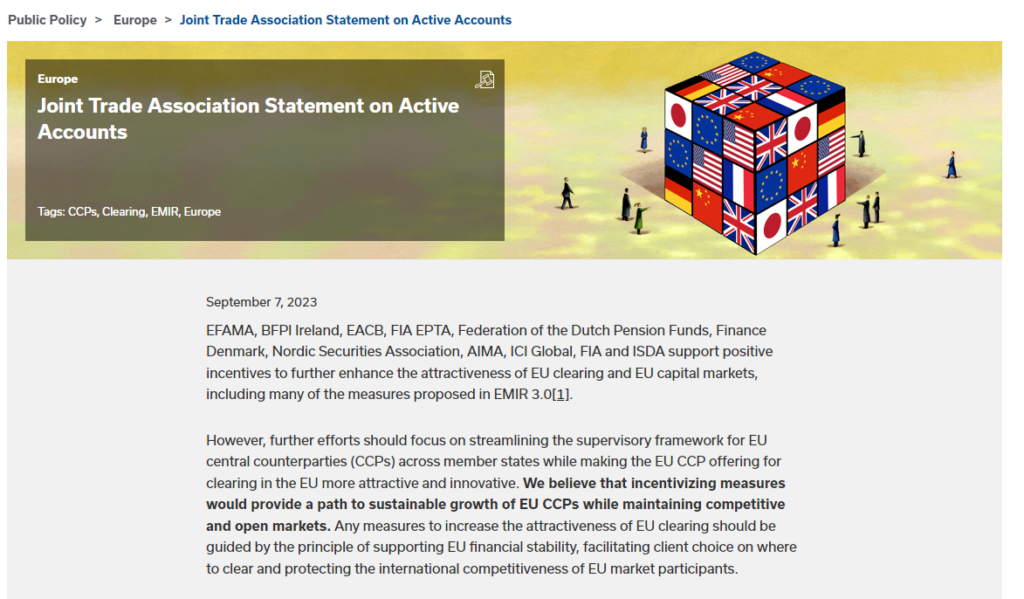
Which says;
- It is important not (to) introduce policies that would disrupt and fragment the global clearing ecosystem.
- The proposed active account requirement (AAR) would negatively impact EU capital markets by introducing fragmentation and loss of netting benefits.
- Quantitative thresholds in the AAR is especially damaging and could lead to a large, volatile and unpredictable price difference between CCPs (called a basis).
- We therefore strongly recommend the deletion of the proposed active account requirement.
In case any of this is new to our readers, Brexit has resulted in a (political) desire in Europe to move the clearing of EUR-denominated instruments “onshore” into European CCPs. A so-called location policy would be an unusual step, but one proposed policy would include Europeans having to maintain an “active account” at a CCP that is physically located onshore in Europe. I have not seen a definition as to what would constitute “active”.
The FT covered this story, including references to our data at ClarusFT (thanks!):
The vast majority of the global business for euro derivatives is handled at London’s LCH clearing house but some politicians in the EU are unhappy that it is concentrated outside their regulators’ direct oversight. LCH is currently managing around €136tn of positions, more than 90 per cent of the global market, according to data from ClarusFT.
FT.com Banks and investors step up opposition to EU derivatives plans
What does the data show?
There are a few aspects to cover in the data. I will refresh most of the metrics I used in the September 2021 blog – Latest EUR Swaps market share for CCPs and SEFs.
CCPs: EUR Rates Market Share – All Products, DV01
Our readers must by now be familiar with our preferred measures of market share. In case not, please refer back to our previous blog.
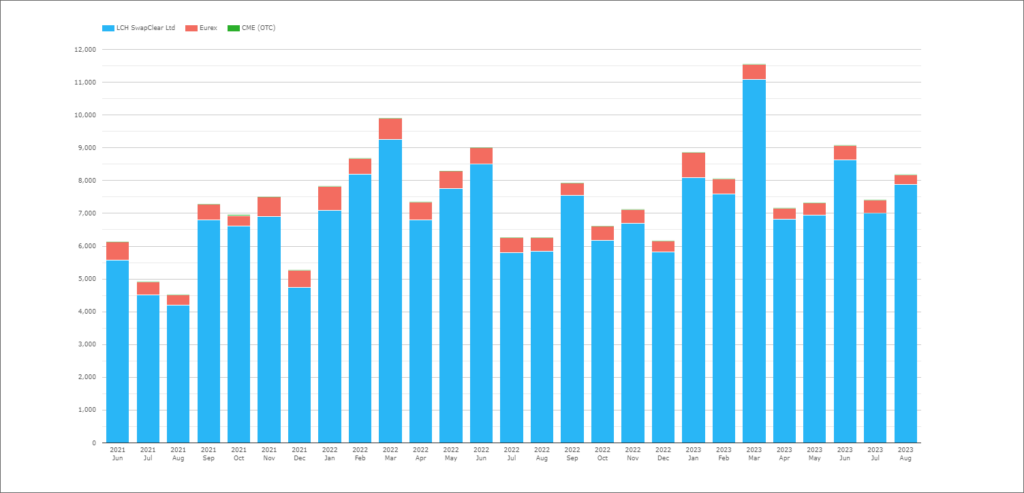
Showing;
- DV01 removes any distortions from large notional, short-dated trades therefore we can include all Rates products here – IRS (vs Euribor), OIS (vs €STR), FRAs.
- DV01 is a fair measure of market share in terms of risk traded across all EUR rates products.
- Overall volumes in EUR Rates have been increasing – as the ECB has been hiking rates.
- Eurex market share has declined slightly from the middle of 2021.
- The next chart shows the market share:
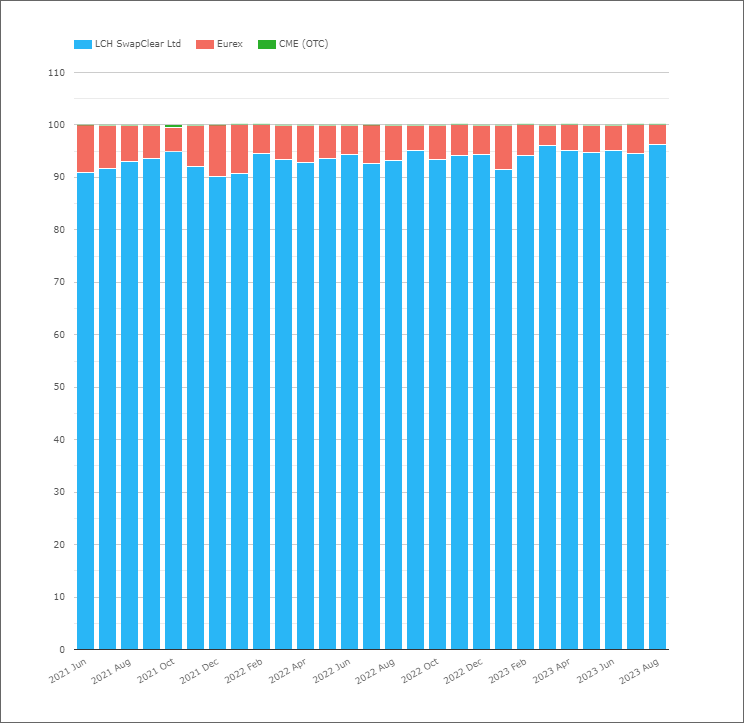
Showing;
- Eurex had a 9% market share of all EUR Rates products (in DV01 terms) in June 2021.
- This hit a high of nearly 10% in December 2021, coinciding with a spike in EUR OIS volumes at Eurex as EONIA was discontinued/transitioned to ESTR.
- Since that high point only January 2022 stands out for Eurex.
- August 2023 saw the lowest market share for a long time for Eurex, at just 3.7%.
- For those not aware, the rest of the EUR OTC market is cleared at LCH SwapClear.
- CME do see sporadic EUR volumes, but SwapClear have recently enjoyed a 95%+ market share.
Our readers will note that Amir covered similar data in his blog 2Q23 CCP Volumes and Share in IRD. The same blog noted that the Eurex market share is lower in OIS than IRS. With a record amount traded vs €STR in August 2023, this likely explains the lower Eurex market share.
CCPs: EUR CRD Market Share – Combined Index and Single Name
The impending shut-down of ICE Clear Europe is the one to monitor here:
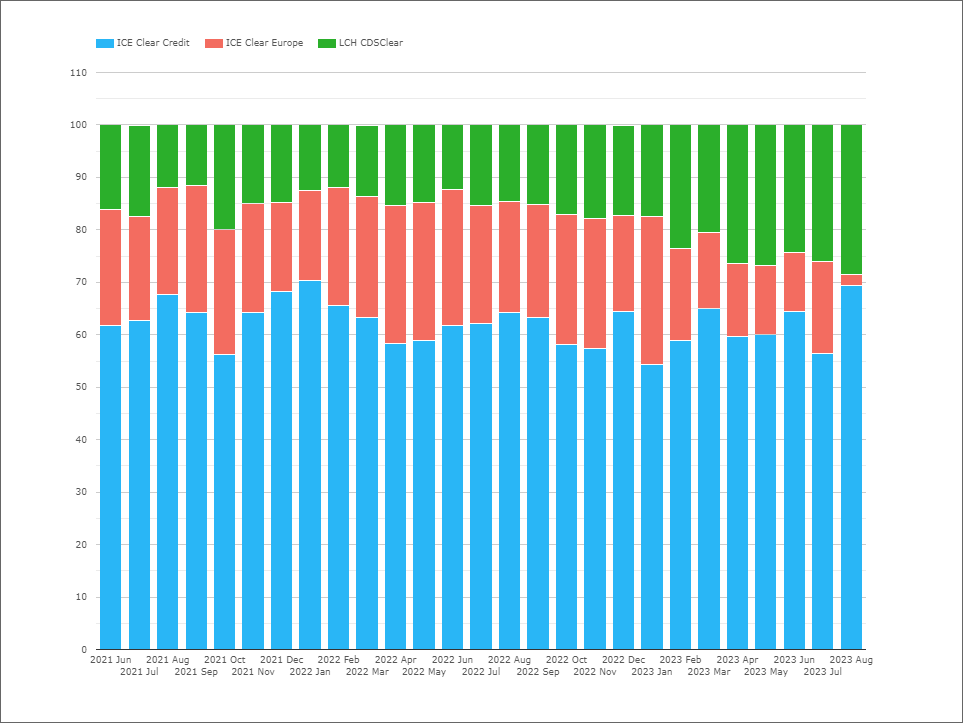
Showing;
- Combined ICE market share (across both US and European CCPs) was 80-90% in 2021.
- This was relatively stable in 2022.
- However, as the transfer date in March 2023 approached, the market share of LCH CDSClear began to increase in February this year.
- LCH CDSClear recorded a 28.5% market share in August 2023.
According to this Risk.net article, both CCPs are happy with the result. You can see why – there is likely more netting in place in the larger US clearing house now, whilst some of the European-only clients may have opened new accounts at LCH.
The on-going evolution of the market share from here will be interesting (ICE Clear Europe will close completely in October according to the Risk.net article).
SEFs: EUR IRS Traded on a SEF
We track the portion of global EUR rates markets traded on-SEF using our API (microservices) which neatly combines SEFView and CCPView data sets.
This feature of IDB markets has become entrenched since we first started looking at it in January 2021. We now see a significant portion of the global EUR D2D markets executing on-SEF every month.
The proportion of the market now traded on-SEF is between 15 and 30%, depending on whether we measure it using notional or DV01:
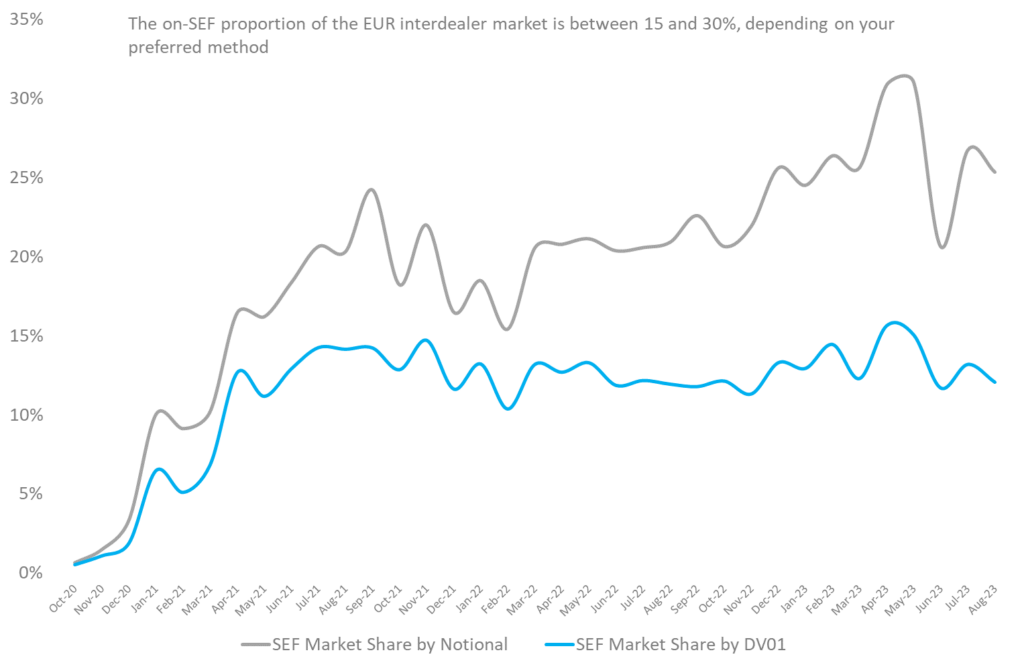
Showing;
- Volumes in EUR rates products – both IRS (Euribor) and OIS (€STR) – traded on-SEF.
- We compare this to the cleared notional volume for House activity at LCH SwapClear in EUR IRS and OIS products. This is a fair reflection of the size of the dealer-to-dealer EUR Rates market.
- The chart makes great reading for SEFs!
- 2023 has seen record EUR notional and DV01 traded on-SEF.
- Up to 30% of total EUR Rates volumes in the Dealer to Dealer market are now executed on-SEF.
However, for the data geeks amongst us (I must admit to being a fully paid-up member of that particular club!) it is really striking that the market share is so different between notional measures (up to 30%) and DV01 (up to 15%).
A potential driver of this difference could be a move away from FRA trading and toward Single Period Swaps for hedging EURIBOR fixing risk. However, the data does not back this up. SEFs are still reporting this activity as FRAs – has the industry forgotten that FRAs are incompatible with fallbacks?!
We will continue to monitor both measures (DV01 tends to be our preference!) and report back in due course. Stay tuned.
SEFs: CDS traded on a SEF
Finally;
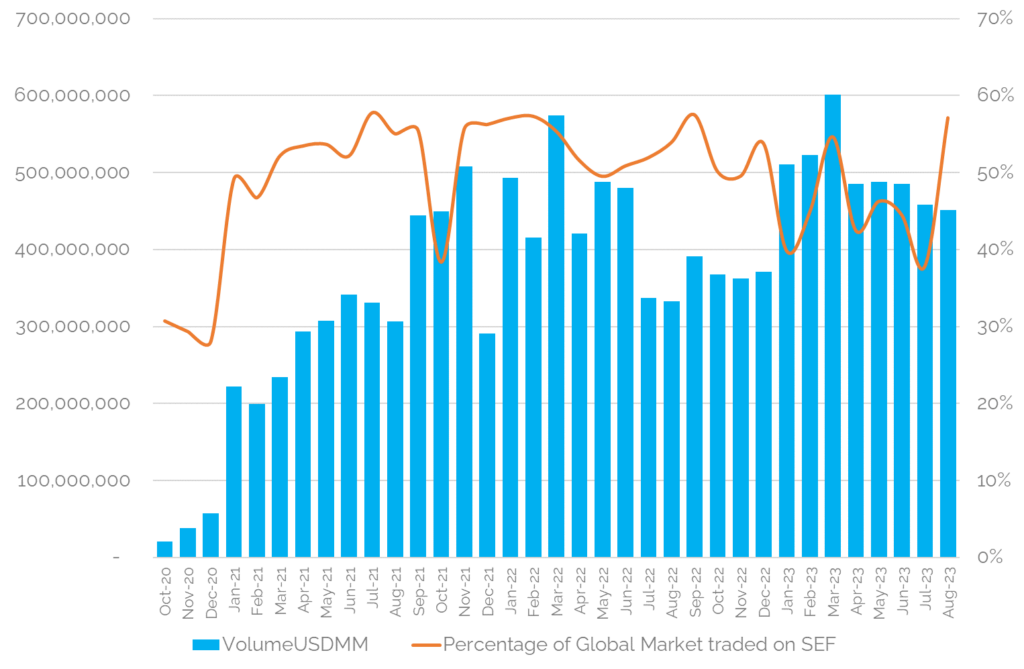
Showing;
- 55-60% of the global EUR CRD Index market trades on SEF.
- This covers both D2C and D2D SEF venues.
- This has increased from below 30% in 2020.
- On-SEF monthly volumes in EUR CRD Index trades now average over $275bn each month (excluding rolls), up from $166bn from Q4 2020.
- The transition out of the ICE Europe CCP does not appear to have impacted SEF volumes.
In Summary
- ISDA and other trade groups have published a statement on a proposed “active account requirement” for European market participants.
- We take a look at the data behind clearing of EUR denominated derivatives.
- Eurex market share in EUR derivatives sits at 4-6% when measured by DV01 of new trades.
- Between 15-30% of dealer to dealer EUR swap trades now execute on a SEF.
- Up to 60% of cleared EUR CDS trades execute on a SEF.