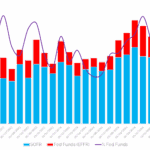
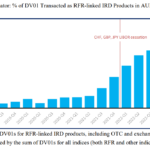
RFR adoption in cleared rates swaps – 2025 update
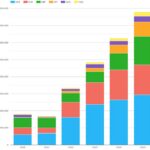
Some time has passed since our last blog on the transition to risk-free rates (RFRs). Here we explore what cleared rates swap volumes tell us about the status of the RFR transition. The volumes also tell us what might be necessary for further material progress. Key takeaways Prompted purely by the volumes, these hypothetical cessations […]
Q3 2025 rates ETD exchange and CCP competition
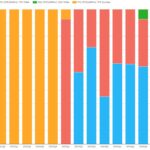
This blog looks at competition for trade volume in Q3 2025 between rates exchange-traded derivatives (ETD) exchanges and CCPs. Key takeaways: In Q3 2025, only two currency and product type combinations – EUR money-market (MM) futures and JPY MM futures – had material competition between CCPs. Read on for more details. Competition overview CCPView gives […]
Derivatives innovation: SOFR futures, TONA futures, MYR swaps
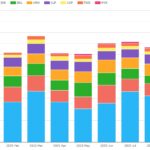
Today, we look at three recent start-ups or new products introduced by derivatives exchanges and clearinghouses (CCPs). Key takeaways: All the charts, data, and statistics in this blog were sourced from CCPView. FMX rates futures FMX is a fixed income e-trading platform focused on US Treasury bonds, FX, and repo owned by BGC. Recently, FMX launched the […]
CAD swaps – what’s new?
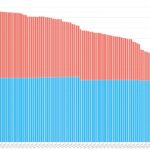
Given that over a year has passed since CORRA cessation, I wanted to illustrate the transition using CCPView and SDRView volumes. So, I will bias the 2025 edition of this blog towards CDOR-CORRA volumes review, while briefly covering CAD derivatives volumes along the way. Last year’s edition of this blog is here and our prior […]
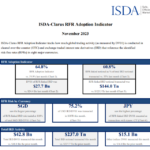
Recreating the RFR Adoption Indicator
This blog is unashamedly targeted at our data subscribers. Specifically, those of you interested to replicate our RFR Adoption Indicator. Read on for your “cut out and keep” guide to RFR data. A Bit of History Clarus and ISDA teamed up way back in 2020 to “help derivatives market participants keep tabs on progress to […]
RFR Adoption Q3 2024
Time for a quarterly check-in on RFR trading. The data provides a high-level overview of trading activity across all Rates products. Clarus API – CCPView As a reminder from previous blogs, Clarus microservices allow me to query numerous volume measures from CCPView. That means I have rebuilt the RFR Adoption Indicator using just two queries to pull in DV01s traded across all products […]
RFR Adoption Q2 2024
Time for a quarterly check-in on RFR trading. The data provides a high-level overview of trading activity across all Rates products. Clarus API – CCPView As a reminder from the previous blog, Clarus microservices allow me to query numerous volume measures from CCPView. That means I have rebuilt the RFR Adoption Indicator using just two queries to […]
RFR Adoption Update
We have had a number of people reach out and ask when the RFR Adoption Indicator will next be updated. It is a great vindication of all of the hard work that has gone on over the past 4 years (and even longer when you consider the wider work on LIBOR cessation, Fallbacks and Benchmark […]
RFR Adoption Review 2023
Now seems like the right time to call an end to the regular series of blogs that we have been writing about the ISDA-Clarus RFR Adoption Indicator. Consider today’s blog your “cut-out and keep” guide to one of the biggest changes the derivatives industry has ever witnessed. A Brief History The Indicator was first published […]
A Final Check-In On RFRs For The Year
This is my final blog for the year, but the 2023 retrospectives will have to wait for January once all of the data is in. However, as the year draws to a close, I doubt 2023 will be remembered as the year that USD LIBOR finally ceased. That has to be considered a good thing. […]