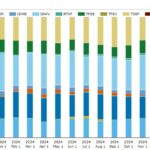
Swaption volumes by strike – Q4 2025
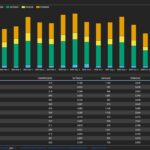
This post continues our quarterly strikes analysis of USD swaptions, which are typically 50 percent or more of swaptions volumes in all currencies. If you are new to swaptions, some basics are outlined at the start of the earlier Q1 blog. You may also wish to keep open on the side our recent blog on […]
2025 SDR-reported IR compression
This blog expands to the whole of 2025 the blog we published last September covering H1 2025 SDR-reported IR compression. Key takeaways For 2025 as a whole: Background SDR-reported IR compression volumes include SEF compression and bilateral compression but exclude the following: As well as the prior blog linked above, further background on SDR-reported IR […]
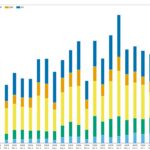
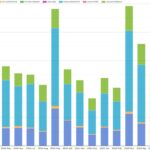
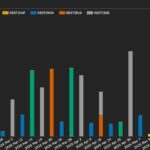
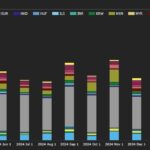
2025 swaption volumes and market shares
This blog reviews 2025 full-year swaption volumes, their split between on- and off-platform, and the market shares of platform groups. We focus on the swaptions in the top four (G4) currencies using SDRView to aggregate volumes and trade count. Key takeaways For G4 swaptions in 2025 compared with 2023: Read on for the charts and […]
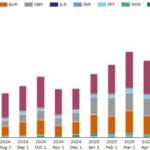
2025 cross-currency swap volumes and market shares
This blog reviews 2025 full-year cross-currency swap volumes, their split between on- and off-platform, and the market shares of platform groups. We focus on the cross-currency basis swaps in the top five currencies, using SDRView and SEFView to aggregate volumes, DV01, and trade count by month and year. Key takeaways For the top five currencies’ […]
Derivatives innovation: RTX and D2D execution automation
This blog looks at RTX Fintech & Research (RTX), a recent start-up interest rate swap SEF (Swap Execution Facility). Key takeaways: Read on for more details. All the charts, data, and statistics in this blog were sourced from SDRView. D2D SEF development After the 2008 Global Financial Crisis (GFC), the G20 consensus and national regulators exerted pressure […]
Volumes and most active names in credit derivatives – September 2025
Today we look at issuer names most actively traded based on CDS trades reported to US SEC Securities Based Swap Data Repositories (SBSDRs) in September 2025. Background The prior similar blog covered credit derivatives (CRD) for July 2025. Given the CDS-market peaks naturally in March and September, we will focus on those months going forward. […]
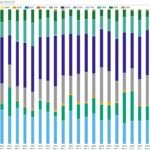
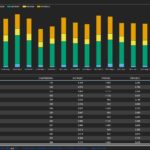
IRD D2D and D2C platform shares at the end of Q3 2025
Today, we look at trading platforms’ September 2025 market shares of volumes of OTC interest rate derivatives (IRD). If you prefer, you can skip to the end for a summary of market share statistics before returning to the start to read the details. Volume context for platform market shares Throughout this blog, we look at the volumes and platform shares of SDR-reported rates OTC trades over the 15-month period from 01 July 2024 to 30 September 2025. […]
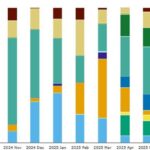
Swaption volumes by strike – Q3 2025
This post looks at USD swaptions activity in Q3 as part of our regular quarterly coverage, the most recent of which was Swaption Volumes by Strike – Q2 2024. We use SDRView data, which shows all trades reported by US financial firms to US SDRs. If you are new to swaptions, some basics are outlined […]
Reset optimization: part 1 – FRA activity
Our recent blog noted that FRA compressions were $18.8 trillion of the total $97.4 trillion SDR-reported in H1 2025. The $18.8 trillion FRA compressions were dominated by the EUR currency and by the OSTTRA REST platform. I skipped further analysis to tee up a separate analysis in this blog. Key takeaways Background Multilateral reset optimization […]
H1 2025 SDR-reported IR compression
Following our introductory blog, 2024 US SDR-Reported IR Compression, published in May 2025, we review today the same compression volumes for the first half of (H1) 2025. Key takeaways Background Note that SDRView is roughly half the total swaption compression volume, because trades are only reported to SDRs if they involve a US party. Nonetheless, […]