- Did you know that volumes in CZK interest rate derivatives have increased ten-fold in the past five years?
- CZK is now the largest Rates market amongst CE3 currencies.
- In the same time-period, HUF cleared markets have actually shrunk.
- PLN markets have grown by about 50%.
- Did the expiry of the Exchange Rate Commitment in CZK markets lead to an explosion in derivatives trading or was it due to the inclusion of CZK bonds in Emerging Market indices?
How much of central European Rates markets are now cleared? Let’s dig into in the data to find out!
BIS Data
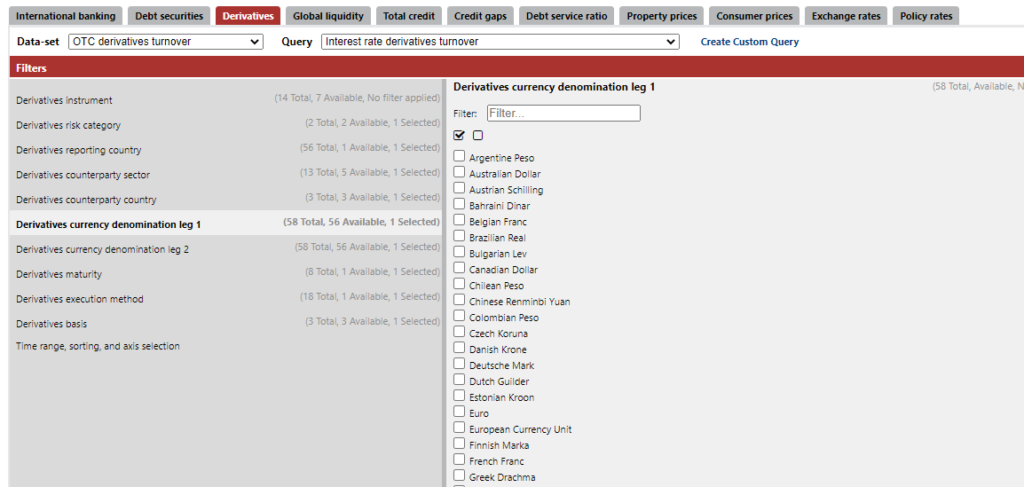
The BIS continues to refine the excellent Statistics Warehouse. For motivated users like myself, we can now see that many more currencies are available, covering up to 58 currencies for interest rate derivatives. I noticed this in the 2019 methodology and data is available all the way back to 2010:
This means that we have a point-in-time window into average daily volumes for every currency traded in interest rate derivatives.
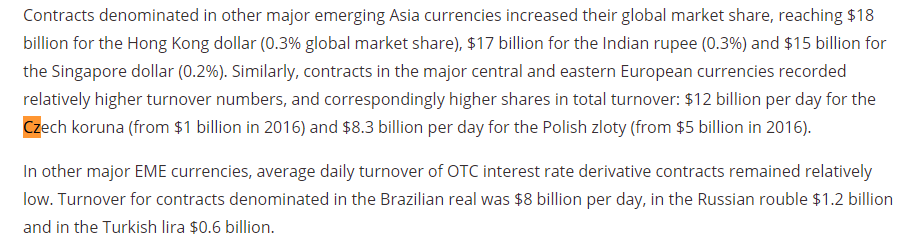
For today’s blog, I will concentrate on CE3 markets. We can see increases in cleared volumes in CE3 over the past 5 years from CCPView:
Read on to see whether this has been repeated in uncleared markets and what it means for clearing rates in CE3 currencies.
Global Volumes in CZK, HUF and PLN markets
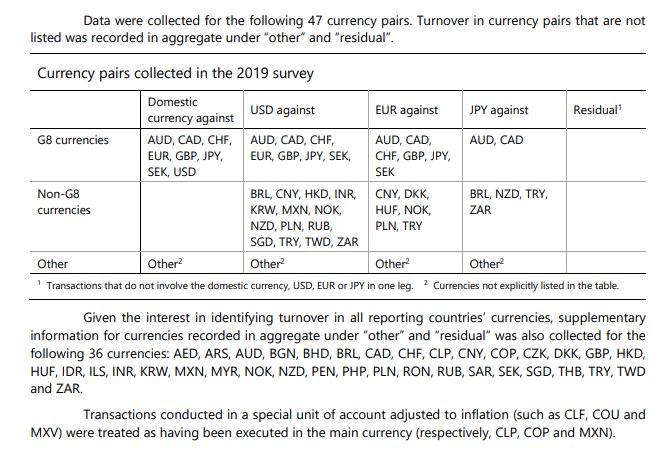
The data provided on CZK, HUF and PLN interest rate derivative markets by the BIS is part of their Triennial Survey (i.e. every three years). As a refresher here is an overview of this data:
The BIS Triennial Survey
- Central banks and other authorities collect data from banks and other derivatives dealers headquartered in their jurisdictions and report national aggregates to the BIS, which then calculate global aggregates.
- Covers a wide diversity of dealers, including dealers active in smaller markets who may not be active in the major derivatives markets.
- Includes both Turnover and Notional Outstanding data.
- The turnover part of the Triennial Survey is reported by the sales desks of reporting dealers located in participating countries, on an unconsolidated basis.
- Reporting dealers include trades between their own branches, subsidiaries and affiliated firms.
- Cleared trades are reported on a pre-novation basis in the turnover part of the survey (i.e. with the original execution counterpart as counterparty).
- Dealers located in 52 countries participated in the turnover part of the 2016 Triennial Survey.
- This list of reporting dealers stretches to 1283 institutions for Turnover data.
- Full guidelines are here for the Turnover and here for the Notional Outstanding parts of the survey.
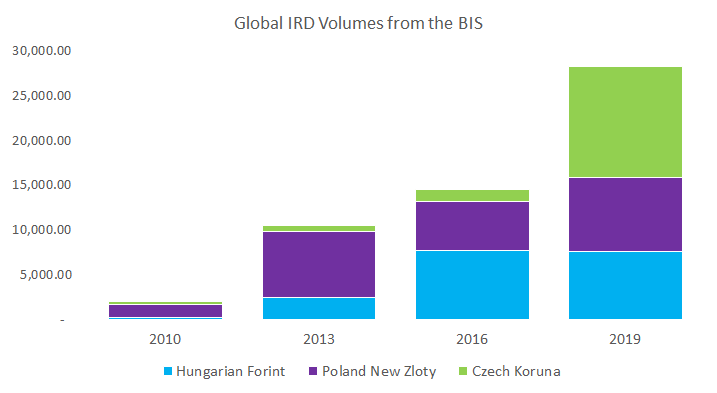
Here are the CE3 volumes in Interest Rate Derivatives as reported since 2010:
Showing;
- Average Daily Volumes (ADV) in million of USD equivalent for all Interest Rate Derivatives denominated in HUF, PLN and CZK.
- This covers instruments such as interest rate swaps, OIS, FRAs and basis swaps (and IR options). It does not include Cross Currency Swaps.
- $2bn notional equivalent traded per day back in April 2010. Remember, this is the average per day as reported during the month of April that year.
- Just 3 years later and volumes had increased by a multiple of 5 to $10.5bn per day!
- Fast forward to the most recent observation, 2019, and there was $28.2bn notional activity each day.
- The split amongst these currencies has changed significantly over time. We will take a look at this in our next section.
Before I look more closely at the clearing data, I love how the BIS just casually drop in the fact that CZK volumes increased from $1bn to $12bn a day between 2016 and 2019! Is that really possible? Seeing as the data made it as far as the commentary, I assume it was well checked and verified:
Cleared Volumes in CZK, HUF and PLN markets
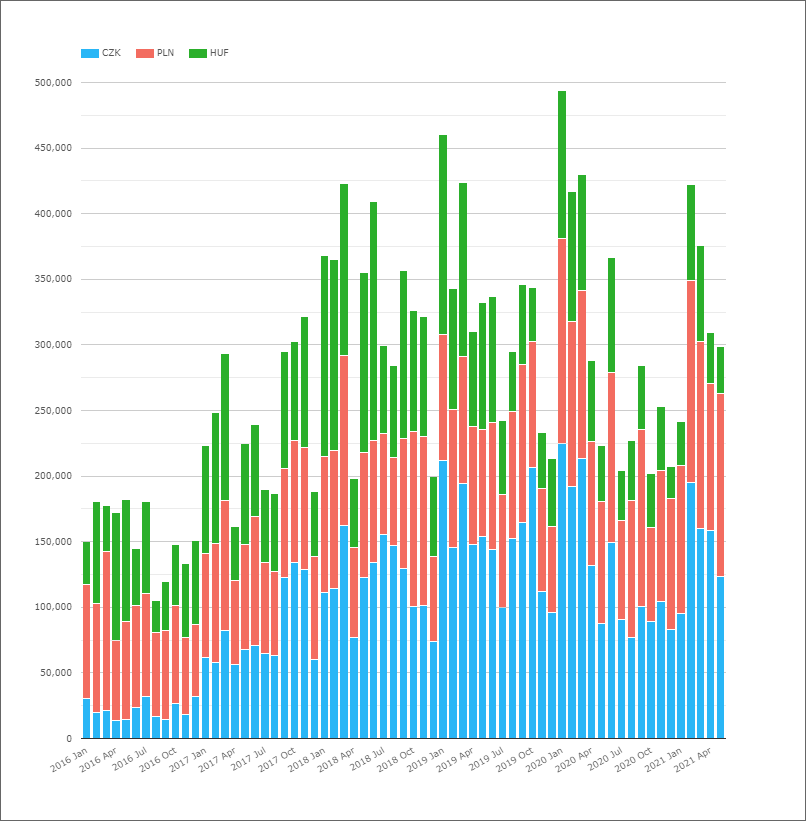
As we presented above, we typically show monthly volumes as opposed to ADVs from our CCPView data app. However, let’s compare like with like to make life easier:
Showing;
- We have data back to 2014 for cleared swaps in these three currencies.
- At the beginning of our time-series, it was not uncommon for a whole month to pass without an interest rate derivative in one of the three currencies trading. This was early days for clearing in these swaps.
- After 2015, HUF, PLN and CZK was a daily activity in clearing.
- The chart makes plain that different currencies have enjoyed different fortunes since 2016.
- HUF volumes have shrunk, from an ADV of $4.6bn to $3.3bn. Anyone following our blogs will know that this is relatively unusual.
- For reference, in April 2021, ADVs in HUF were just $1.7bn (although this was a particularly low activity month). Looks like HUF markets are really struggling though (at least in clearing).
- Things couldn’t be more different in CZK! Similar to the story painted in the BIS data, clearing volumes have exploded!
- CZK saw an ADV of just $650m in April 2016. This has increased ten times to $6.7bn in April 2019 and April 2021 saw $7.2bn ADV.
- What is causing CZK volumes to sky-rocket?
- PLN volumes in clearing used to be much larger than CZK but are now playing second fiddle. They saw decent growth in the 3 years, climbing from $2.9bn per day in 2016 to $4.1bn per day in 2019. They have since increased to $5.1bn in 2021.
Clearing as a portion of the market
The most recent BIS survey dates back to 2019. See our coverage here. This will be updated again late in 2022. For now, let’s compare the 2016 and 2019 data to our CCPView data. Remember that CCPView data is updated daily, no waiting for three years at Clarus for fresh data!
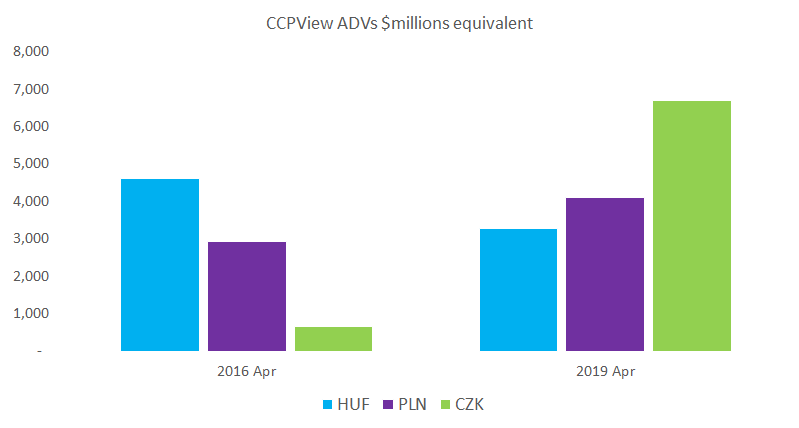
- In CZK markets, both Cleared and Uncleared markets have seen massive increases in volumes in the three year period.
- The clearing rate has increased in the intervening period, but not by much. It increased from 48% to 54%.
- It is remarkable how much both areas of the CZK market have grown. I’m left scratching my head somewhat as to what has caused it?
There must be a significant story behind the large leap in CZK IRS volumes. The only hint I can find is that the Czech central bank operated an Exchange Rate Commitment between November 2013 and April 2017. When the FX returned to a “free-floating” value in 2017, it was widely expected to significantly appreciate. However, why this would lead to a sustained large amount of IRS trading over the next four years is somewhat puzzling. The amount of CZK bonds being issued by the government hasn’t increased significantly, but maybe the story is tied to the increase in foreign ownership of these bonds? The BIS have a good summary of the CZK monetary policy regime here, but nowhere do they draw out huge increases in either bond market or IRD volumes.
Elsewhere, CZK bonds were “reclassified” as Emerging Market debt by JP Morgan indices back in April 2017. Was this enough to accelerate use of CZK-denominated interest rate swaps?
Any readers with any insights, please let us know.
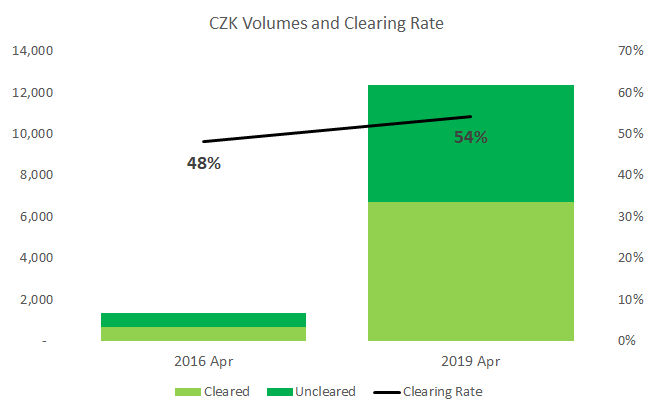
- PLN markets have seen increases in volumes since 2016 across both Cleared and Uncleared.
- The overall market has grown by about 50%, with both sectors (Cleared and Uncleared) growing at roughly the same amount.
- The clearing rate has changed from 53% to 50%. Such a small change may simply be due to a point in time observation.
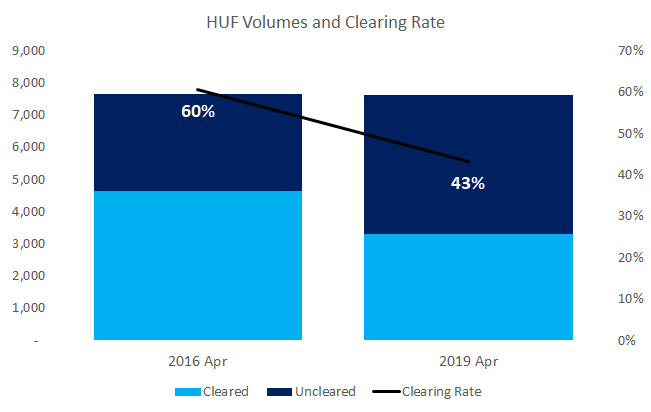
- Finally, HUF markets have stayed at an almost identical overall size since 2016.
- However, as we noted with the Cleared volumes, there has been a decrease in the use of Clearing.
- As a result, the clearing rate has fallen a lot, from 60% to 43%. This goes somewhat against the grain in terms of general trends in interest rate derivatives.
In Summary
- CZK markets have grown by a huge amount – they are now ten times bigger than five years ago.
- CZK markets are now the largest Rates market amongst CE3 currencies.
- Both Cleared and Uncleared CZK markets have grown, with a clearing rate increasing to over 50%.
- PLN markets have also grown, but by a smaller amount of about 50%.
- Clearing Rates in PLN are also around 50%.
- HUF has seen stable volumes overall, but with a shrinking Cleared market. As a result, the Clearing rate has decreased to 43%.
- Anyone who knows why either CZK volumes have skyrocketed or HUF volumes have shrunk, please let us know!
It never ceases to amaze how these stories present themselves in the data after all these years. Is the increase in CZK volumes really due to the expiry of the Exchange Rate Commitment or to the inclusion of CZK bonds in JP Morgan bond indices? Please let us know your thoughts….