My recent blog on Archegos, Trade Repositories and Initial Margin, was very popular, so I wanted to do a follow up on the same two topics; transparency of derivatives and initial margin requirements.
For those of you not familiar with the three letter acronym, APA, it stands for Approved Publication Arrangement which is a European MiFID II regulated mechanism for transparency. While Uncleared Margin Rules (UMR) is a global regulation, implemented in most jurisdictions.
Let’s consider each of these in turn.
APAs
Posing the $10 billion question again, which we know from the last blog did not lead to an affirmative answer for the US:
- Had the Archegos total return swap (TRS) trades been conducted under European jurisdiction, would regulators or prime brokers have been able to see the excessive build up in exposure and take pre-emptive mitigating actions to avoid losses?
This time the appropriate post-trade transparency regulation has been implemented in Europe for OTC Derivatives on single stock equities, unlike the US.
However, there is devil in the detail and in this case that devil is in the acronym TOTV, which stands for Traded on a Trading Venue.
The MIFID II transparency regime is based around TOTV and only such instruments are in scope. It is unlikely that the TRS trades in question were on TOTV instruments, in which case these trades would not have been subject to the MiFID II transparency requirements.
Foiled again!
In What we need to do to fix MiFID II Data, getting rid of TOTV for post-trade transparency is one of the points that we believe is critical to effective operation.
However, even had these trades been published by APAs, there is the small matter of ISINs as the only identifier of instruments.
It is probably too much to hope that the instrument identifier for TRS would be the ISIN of the underlying equity, which would be great, more likely I expect each TRS for a specific maturity on an underlying will have a unique ISIN.
And a quick look at DSB-ANNA’s webpage shows 26 million ISINs for Equities, while the monthly metrics report for April 2021, shows that of these the Equity instrument Price_Return_Basic_Performance_Single_Name aka Total return swap on an equity make up 15 million!
Good luck with searching that database or consolidated tape(?) to spot excessive concentration in specific equites.
So I am afraid the answer to my question is again no.
With the caveat that I have not actually tried to look at the data, but given the above and the time available, the cost benefit is heavily skewed to pointless exercise. (If anyone has tried to look for a TRS on a specific equity, please let me know how you got on).
Let’s move onto UMR.
Uncleared Margin Rules
UMR requires OTC Derivative trades that are not cleared but bi-lateral to be margined if both parties to the trades are caught by the rules. Currently these are parties with gross notional in otc derivatives of > $750 billion, falling to >$50 billion on Sep 2021 and > $8 billion on Sep 2022.
As well as daily variation margin, exposures needs to be collateralized with initial margin, utilizing either a Standardized Schedule approach (aka Grid) or an approved Internal Model (only ISDA SIMM is in use).
In my prior Archegos blog, I focused only on ISDA SIMM, so today let’s look first at the Schedule approach and use the same example of a buying a TRS on 10,000 Microsoft shares with a market value of $2.5 million.
Schedule IM
Schedule IM uses a table of % of notional rates by asset class as below:
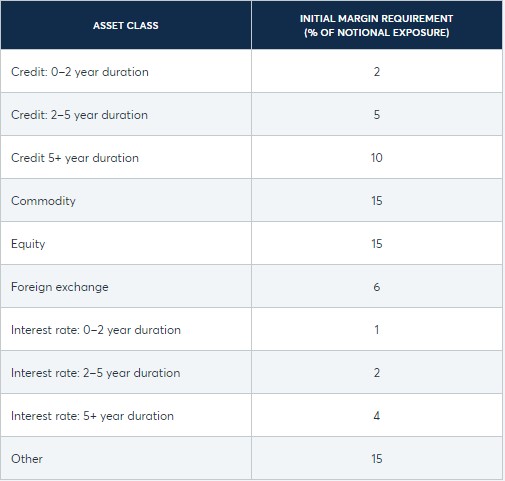
So for our example the Schedule IM would be 15% of notional ($2.5 million) = $375K.
This is less than the SIMM of $600K.
Okay for Microsoft, but not so great for ViacomCBS, Discovery, Farfetch and others stock exposures held by Archegos prior to bankruptcy.
Clearly SIMM is a superior method than Schedule IM.
And then there is the fact that Schedule IM is a gross measure and one follows the familiar Net to Gross Ratio used in the Current Exposure Method:
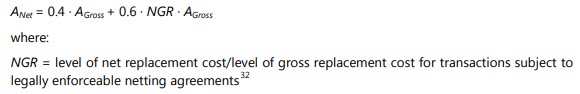
This rapidly grosses up the measures, unless the underlying instrument and maturity date of expsore are the same.
So a second trade of selling 5,000 Microsoft shares but not for 3-month but 6-month, that actually reduces risk would not net with the first and our Schedule IM would be at least 40% of ($2.5million plus $1.25 million) so $1.5 million! Hmm not great at all.
So while Schedule IM quickly becomes very conservative for a portfolio of trades, as for any method relying on gross notional only and not risk exposure, it results in an onerous and un-realistic measure of margin.
It should be used sparingly.
For example for small portfolios that are long only or for one asset classes or product that are exceptions to what a firm trades e.g. I only have a couple of Credit Derivative trades with one or two counterparties and it is simple, appropriate and convenient to use Schedule IM for this and the Credit product class will just be added to my major product classes of Equity and RatesFX.
Otherwise the danger is excessive amounts of trapped collateral.
ISDA SIMM
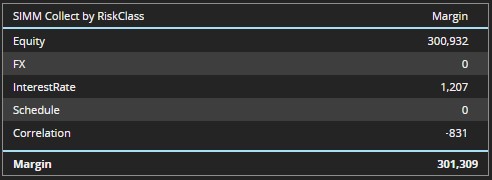
ISDA SIMM is an appropriate risk exposure based method, so buying 10,000 and selling 5,000 would appropriately reduce our IM by 50% from $600K to $300K.
And where we were buying and selling derivatives on different equities, SIMM uses a correlation matrix to provide some diversification benefit in the aggregation, with correlations varying from 14% to 41% depending on the SIMM bucket and same bucket or different bucket correlations.
Using our CHARM service (GUI or API) it is easy to calculate SIMM for a portfolio accounting for the required bucketing and correlations.
Annual Calibration of SIMM
In addition, a point I did not mention in my prior blog was that SIMM is re-calibrated each year for a historical period that includes the recent 3 year rolling window and a stress period.
SIMM v2.3 is the currently used version, which was calibrated with data prior to Dec 2019 and after backtesting in 2Q 2020 and approval by regulators, was implemented in Dec 2020.
Consequently the stress period from the Covid Crisis in February and March 2020 is not included in the curent calibration.
SIMM v2.4 will be implemented in Dec 2021 and is currently or will shortly be backtested with re-calibrated data from Dec 2020 and earlier, so including the Covid stress period.
It will be interesting to see if this results in a material increase in the risk weights for Equities.
Possible but not a given.
What I think is more important is a re-calibration of the concentration thresholds and not just for Equities.
I covered these in a Nov 2019 blog for interest rate risk and observed then that they were far too high in comparison to CCP concentration thresholds, but they are still as they were.
Perhaps a revisiting of concentration thresholds will now become a higher priority and be implemented in-time for Phase 6 counterparties in 4Q 2022.
Final Thoughts
MiFID II transparency in Europe is not effective for Equity TRS.
It would not have been useful for Archegos trading.
Hopefully MiFID II transparency will improve with upcoming simplifications.
UMR allows for Schedule IM or Internal Models (SIMM).
Schedule IM is far too conservative and onerous.
SIMM is risk based and far superior.
SIMM v2.4 will be re-calibrated with the Covid period.
SIMM concentration thresholds should really be lower.
Models are not a replacement for good judgement.