Since 2016, uncleared margin rules have driven a steady rise in cleared inflation swaps open interest and CCP IM. In July TriOptima announced their first cleared inflation swap compression run, so let’s look at what data on cleared volumes in CCPView tells us.
Inflation swaps in the context of overall IRD volumes
Inflation swaps are a somewhat specialised corner of the IRD trading world. Some statistics can help put the context together:
Using CCPView:
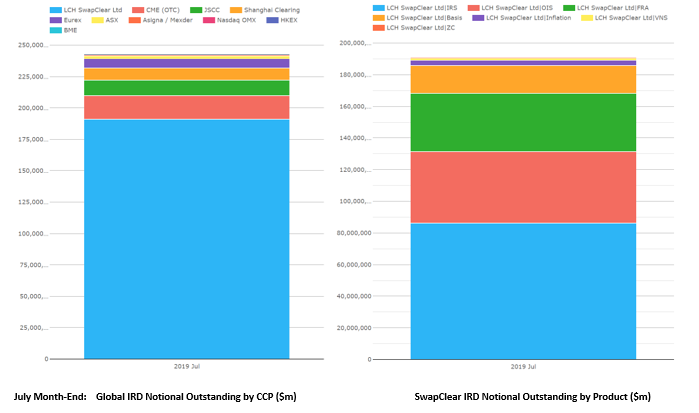
We can see July 2019 month-end notionals:
- $243tn of single-sided gross notional of IRD was outstanding (left hand chart) of which SwapClear was $190tn
- SwapClear $190tn total (right hand chart) was dominated by fixed float IRS, OIS, FRA, Basis totalling $185tn
- Inflation volume (purple bar in the right-hand chart) was $3.2tn so in the 1-2% range of both SwapClear and all CCPs.
Now, let’s look at US persons reported volume in SDRView:
We can see that for Jul 2019:
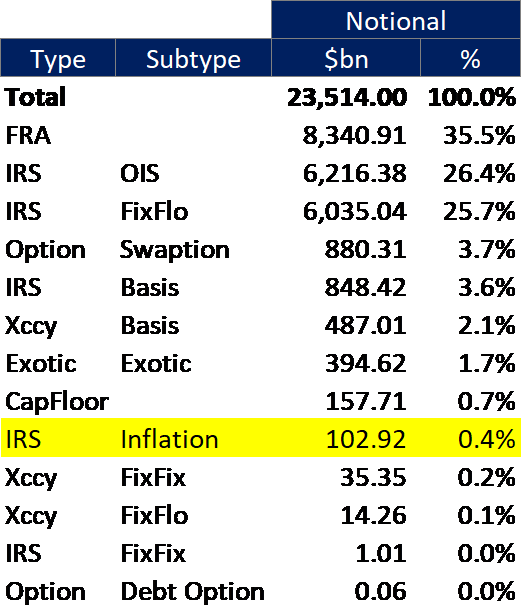
- $23.5tn gross notional of IRD traded
- Dominated by FRA, OIS and fixed float IRS totalling $20.5tn
- Inflation was $100 billion so in the sub-0.5% range, most likely reflecting the fact that EUR and GBP inflation Swap markets are larger than USD.
A long steady increase in clearing
The steady increase in cleared inflation swaps, commonly attributed to the onset of UMR from September 2016, can be easily seen in CCPView.
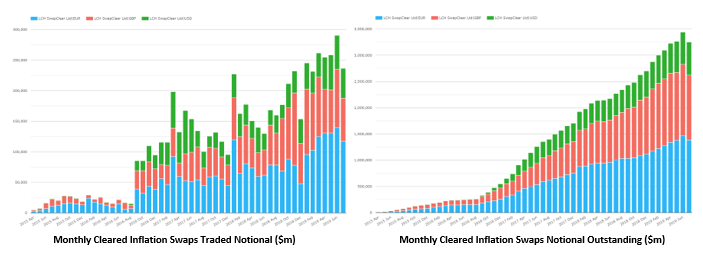
We see that, for the first time ever, July month end OI dropped materially. Traded notional was down on the prior month by around $50bn but notional outstanding dropped about $200bn.
This was preceded by:
- An inflation clearing “proof of concept” before Sep 2016
- A jump in cleared activity (first chart) and faster open interest growth (second chart) from Sep 2016 (Phase 1 UMR go live)
- Global cleared volumes dominated by GBP and EUR with USD a smaller percentage than it is of regular cleared IRS
Observation: with no compression before July, we are just seeing the simple equation of new trades minus maturing trades with change in open interest.
Now let’s check that the clearing increase was an actual shift to clearing not just a general trading volume increase.
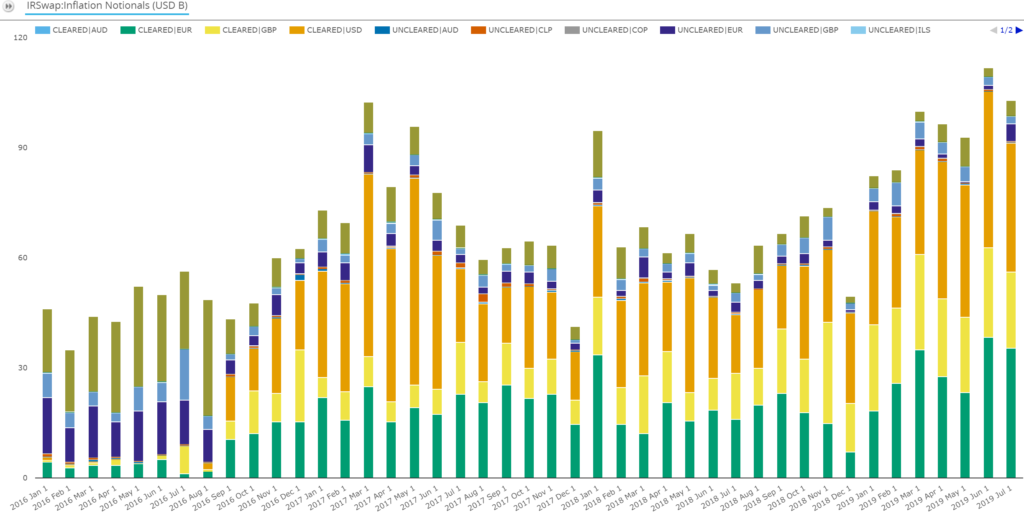
We see:
- Cleared inflation swaps are dominated by EUR (green), GBP (yellow) and USD (orange) with a small amount of AUD (pale blue)
- Among a more gradual market volume increase, US-reported inflation swaps swung over to being mostly cleared almost exactly when UMR Phase 1 went live in September 2016
- US-reported cleared volume around $100bn a month comparing with around $200-$300bn globally from the CCPView above
So far, we can see a first ever monthly downturn in cleared notional outstanding in July which looks promisingly like it corresponds to the TriOptima first compression runs.
So, what happens if we look at daily figures to see if we can see a run pattern?
Daily Notionals
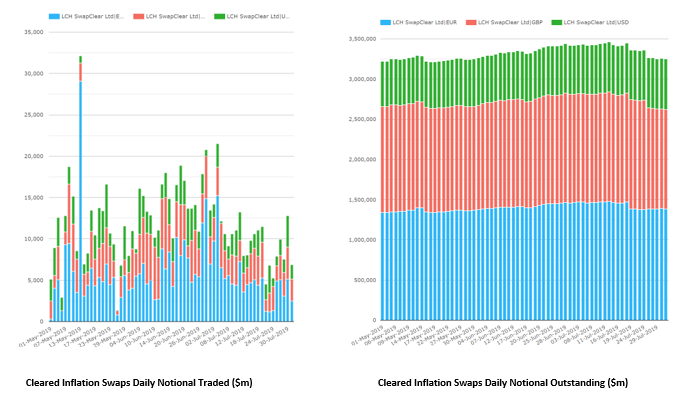
We see:
- The normal seasonality and day to day ups and downs of daily traded notional – in July in the range $5bn to $10bn (left-hand chart). This is the only effect increasing notional.
- A more
sustained pattern of downshifts in notional outstanding in July, mainly
dropping on two days:
- $98bn on July 25 ($102bn all in GBP offset by 4bn increases in USD/EUR)
- $83bn on July 19 ($83bn in EUR with minimal increases in GBP/USD)
- Corresponding
cleared notionals on those days were:
- $8bn on July 25
- $11bn on July 19
- This
implies, on those two days, that compression, trade maturities and other
terminations amounted to a net notional reduction of:
- $100bn GBP swaps on July 25
- $88bn EUR swaps on July 19
- This is far bigger than daily new trades so may well be compression run days.
Sometimes charts alone don’t do it. Let’s pull the data into a spreadsheet and look further back in time to be sure we’re not missing something:
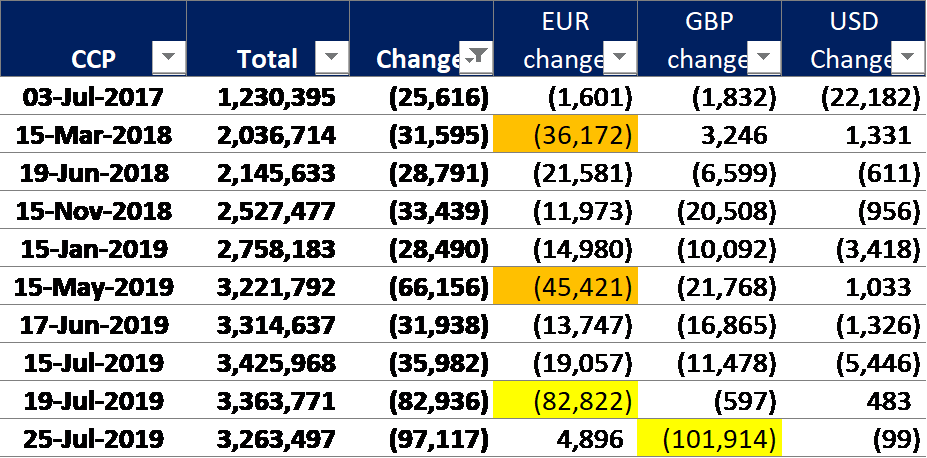
We see:
- Prior to July, there were only two other days where one currency’s drop exceeded $25bn – May 15 2019 and Mar 15 2018
- Absent TriOptima compression, these could be another compression service or bilateral compression or simply a larger than normal peak in maturities.
Observation: The pattern with a single currency dropping on each of our two days seems to be strongest evidence that these drops are not normal market activity.
Corroboration
Given no scientific proof, to corroborate this, I checked with TriOptima. They kindly confirmed the two July dates correspond to their triReduce runs including inflation swap compression. They also hinted they are optimistic of increased participation and therefore more dramatic notional savings from inflation swap compression in future as use of the new service (which is part of the broader cleared IRD compression runs) spreads to more participants.
To date, something approaching $188bn of inflation swaps may have been compressed. With open interest above $3,000bn there is presumably quite a bit more potential.
What is the future potential?
Let’s look at the stats LCH publishes for SwapClear compression as a whole.
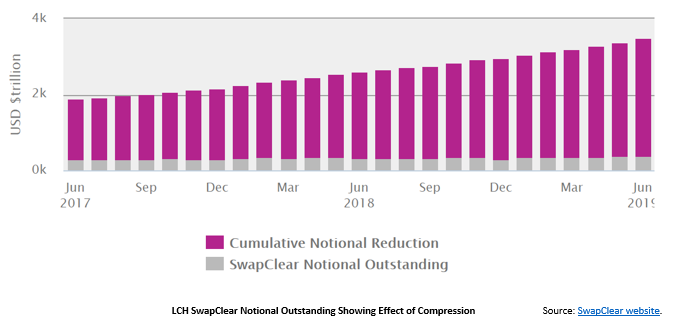
By hovering over the bars on the website, we can see that the cumulative notional reduction is $3,194tn with notional outstanding $382tn. This reflects the established product compression activities in IRS fixed float / basis / OIS and FRA. The $3,194tn figure is slightly misleading as quite a bit of the notional compressed in the past is for trades which would have matured by now anyway.
Nonetheless this gives a general idea that – albeit at a different order of magnitude than other IRS – a chunky slice of the $3.2 trillion single-side gross notional of inflation swaps will get reduced as TriOptima’s service expands participation
Is compression for the long term?
It’s easy to suggest that SA-CCR will mute the bank leverage ratio and capital benefit. This is true in part. At the point of SA-CCR go live (2020 in the US, later elsewhere), a one-off drop in leverage will result from the shift of PFE basis from CEM to SA-CCR. Roughly speaking, CEM PFE per asset class and maturity bucket is based on: (gross notional) x (net to gross ratio) x (reg. percentage per bucket). SA-CCR on the other hand is based on: (net notional) x (netting floor percentage). In short, more powerful netting. (For more, read Chris’s blog SA-CCR for US Banks).
There is, however, another regulatory measure in play – the G-SIB score. This is the metric by which G-SIB banks are compared with one another by regulators. One of the factors in the G-SIB score is gross notional with no weighting or netting at all. In effect, if a G-SIB is relatively lax on notional efficiency (absent any risk sensitivity considerations), it is hit with more G-SIB score driven capital charges. This would seem to mean – at least for G-SIB banks – that compression is here to stay.
Summary
Inflation swaps compression is a recent innovation.
Unlike pre-existing IRS and FRA compression, because there was no compression before, it’s easier to spot the new trend using CCPView.
Though this is relatively small, perhaps $1tn or more of notional is available to be reduced.
Watch out for another blog to update you over the coming months.