I keep a close eye on what is going on in Cross Currency Swaps, but somehow I missed quite how significant the past few quarters have been in terms of volumes traded. Let’s take a look.
All-Time Record Volumes
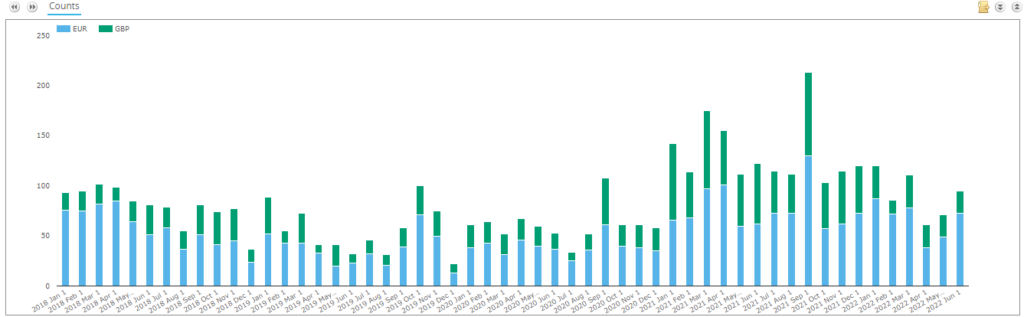
Taking a look in SDRView shows significant volumes in EURUSD and GBPUSD during 2022:
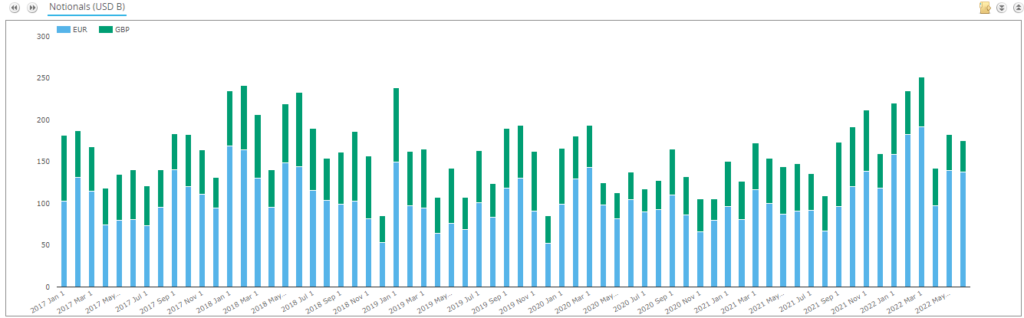
The chart looks at two of the major currency pairs – EURUSD and GBPUSD – and presents the volumes reported by US persons to US SDRs. Digging into the details:
- March 2022 saw over $250bn in notional reported to US SDRs for the first time ever for these two currency pairs. It was an all-time record month.
- Feb 2022 was the 5th largest month on record, Jan 2022 the 8th largest.
- October and November 2021 are not far behind in the record books either, within the top 15 months ever.
All this means that on a quarterly basis, volumes have hit records:
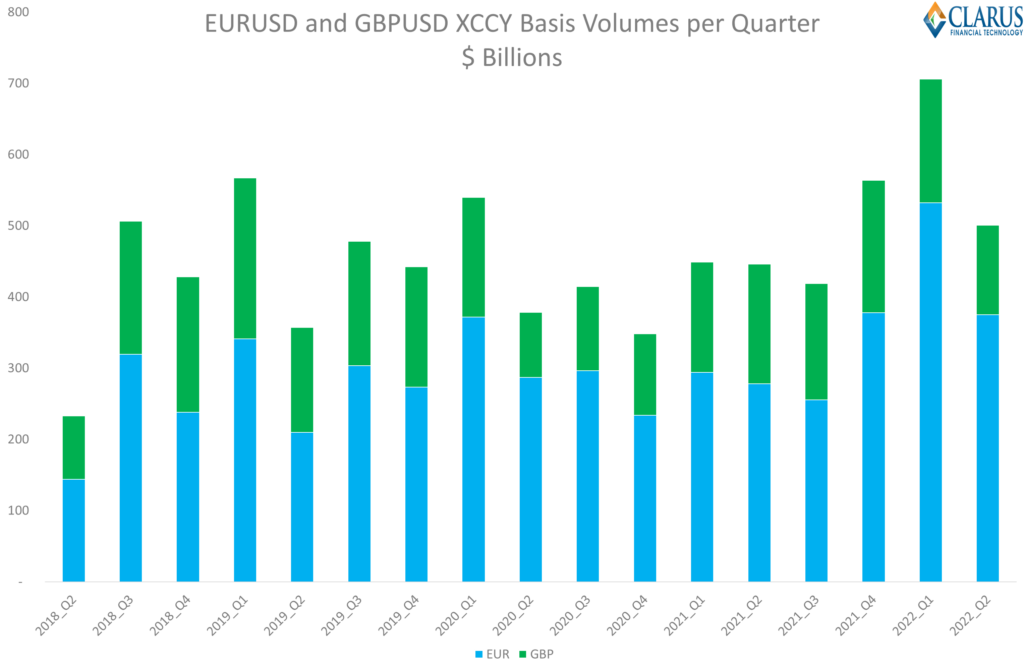
This is the same volume data as the previous chart, just grouped by quarter. The different grouping goes to show how outsized volumes have been:
- Q1 2022 was an all-time record quarter. And it wasn’t a record by a small amount. It saw volumes that were 25% larger than the previous record volume quarter, Q1 2019.
- Q4 2021 saw larger volumes traded in Cross Currency basis than even Q1 2020, when we were in the midst of a global pandemic.
- Volumes have since reduced by about 40% in Q2 2022, but that is still the 6th largest quarter on record. Quite incredible that volumes have been so large!
An Almighty Transition
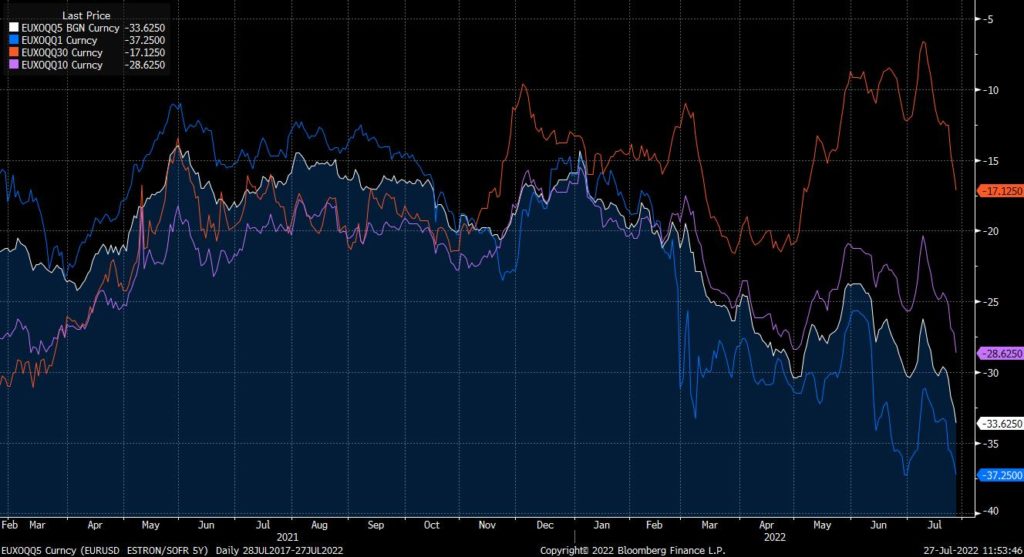
Just in case our readers have forgotten (!), these all-time records have been witnessed during a transition to RFR vs RFR trading. Virtually 100% of the volumes in XCCY basis are RFR vs RFR in these currency pairs now:
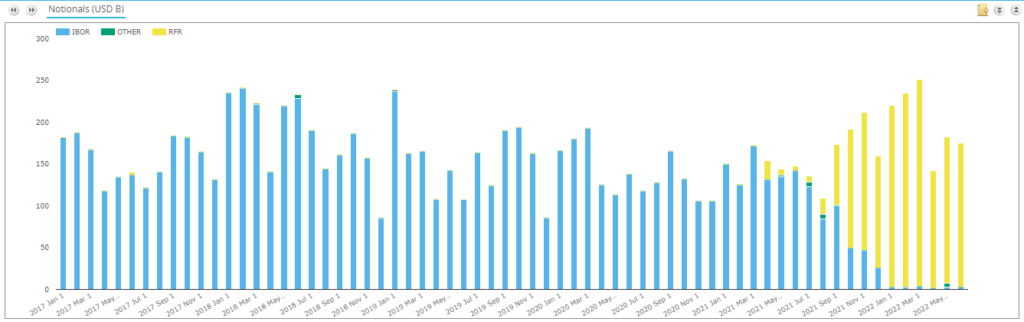
As someone who has long advocated that OIS vs OIS XCCY is the most sensible product to trade for basis traders, it’s highly reassuring to see that the adoption of this new product has also been accompanied by a commensurate increase in volumes.
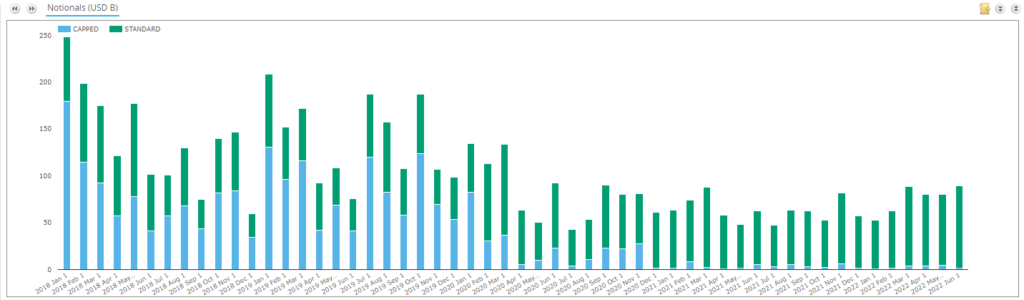
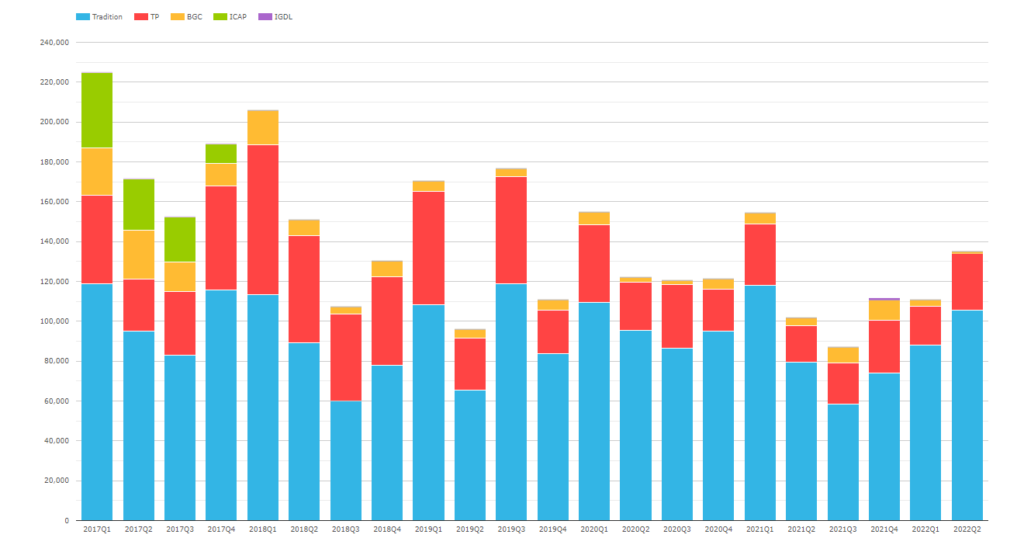
Block Trades
Before we get too excited, it is worth pointing out that these hugely elevated volumes have not been carried through into block trade activity. In 2022, under 7% of all cross currency basis trades are reported at their capped notional amounts (“block trades”).
So whilst we do see a record number of total trades….
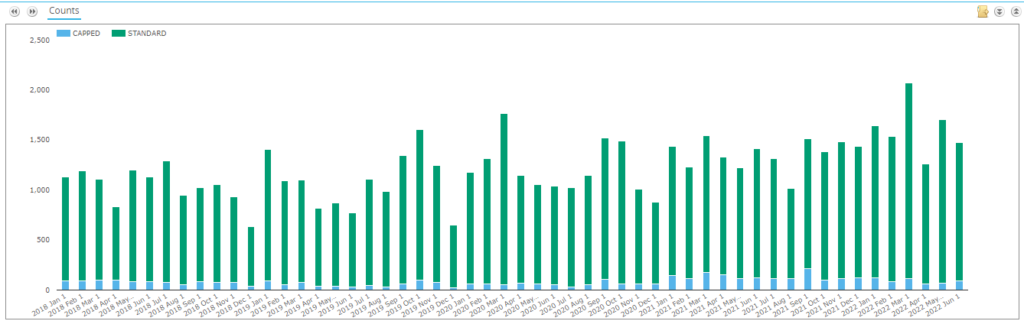
…the number of large notional trades is well below any records:
This is, of course, a concern for market-makers (and potentially end-users). It speaks to a market where demand is very high, but that it is increasingly difficult to move a single large block of risk. Rather, more trades must be performed per large client trade to move a given amount of risk. Interesting….I know if I were still a trader, this would be construed as markets being “more difficult to trade” and people inevitably moaning about lack of liquidity….
Risk and DV01
All of which brings me to investigate the amount of risk being moved through the system. We are seeing large notional amounts trade, and large numbers of trades. But they are not breaking any records for block trades. This does suggest that the amount of risk being traded is large – these are not simply short-dated trades, which would largely be above the block threshold. Let’s see what the DV01 data shows:
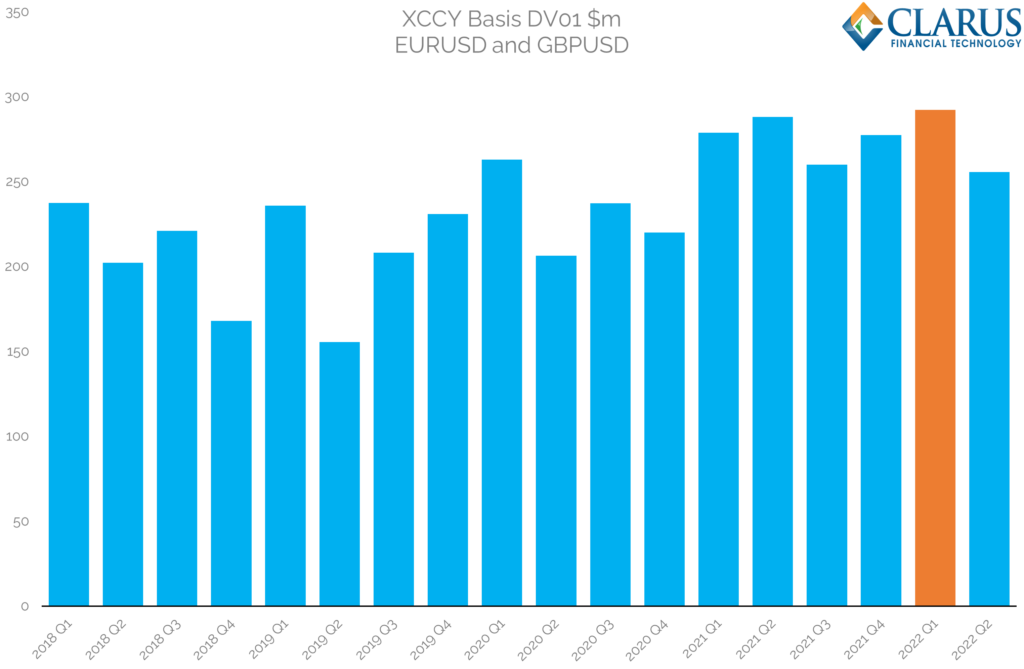
Showing;
- As anticipated, Q1 of 2022 was indeed an all-time record period for the amount of DV01 traded in EURUSD and GBPUSD cross currency swaps.
- However, it was only just a record. Whilst notional amounts were 25% larger than during any other period, the amount of risk transferred was only 2% higher than the previous record quarter, Q2 2021.
- Given that the number of “block” trades during Q1 2022 was also likely lower than that in Q2 2021, it is hard to say unequivocally that it was a record month for the amount of risk transacted.
- It likely speaks again to the fact that trading conditions are “difficult”. There is a relatively large amount of risk to move, but it has to be done in a greater number of smaller tickets.
SEF Volumes
SEF volumes are not capped at the reporting threshold. Therefore, for the portion of the market trading on-SEF, we get a better idea for total volumes traded. This reveals that Q1 2022 was indeed an all-time record across EURUSD and GBPUSD markets:
This is very similar to our chart of DV01 volumes above, suggesting that Q1 2022 was indeed an all-time record quarter for XCCY volumes.
All XCCY Basis
Before we get too excited, it is worth noting that USDJPY (and other markets) do not appear to have been swept up in the same excitement. This has been a “European” phenonemon:
USD JPY XCCY basis volumes at SDRs:
And USDJPY XCCY volumes at SEFs:
It is really striking the difference in volume evolution between the different markets, particularly given that the USD has performed so strongly versus all three currencies in FX markets. Is this about USDJPY being more directional? Is this an RFR transition story for €STR vs SOFR? It’s really tricky to pick out the pieces here. Or is it simply because EURUSD has turned so much more negative throughout 2022?
Trying to work out whether volumes lead the basis or the basis leads the volumes is a life’s work for markets like these!
In Summary
- Q1 2022 saw all-time record volumes reported to US SDRs for EURUSD and GBPUSD cross currency swaps.
- Notional amounts traded beat previous records by 25%.
- In terms of the risk traded, Q1 2022 was only just a record quarter, by 2%.
- This is supported by both SEF data and the relatively reduced number of large “block” trades.
- The same cannot be said for volumes in USDJPY, which are relatively subdued in 2022.
- Transparency data gives us an important insight into market conditions.