The fallback spread is an essential component of the LIBOR cessation plan and represents the credit and liquidity component of LIBOR relative to Risk Free Rates (RFRs).
In a case where a benchmark like USD LIBOR ceases to publish, fallbacks such as compounded SOFR plus the spread are used to replace the failed benchmark.
ISDA has published the results of their consultation on the spread calculation methodology in November 2019 and how it is applied to derivatives. Also, in April 2020 the ARRC has published the recommendations for the spread methodology for cash products.
Although the methodologies are very similar, they do diverge in some ways for consumer products. The spread is a calculated as the 5-year median which is added to the compounded SOFR over the period in both cases. However, in consumer cash products, a 1-year transition period is included so there is no potential ‘step’ from the current spread to the 5-year median.
My last blog looked at the how benchmarks are faring in high volatility. The spread expanded from 70 bps on 12th March 2020 to 140 bps on 27th March.
In this blog, I look at the current USD spread and how that may evolve over the next few months.
The current volatility and unusual FED Target Rate changes between meetings have tested the methodologies.
Spread calculation methodology
One of the challenges I have written about in a previous blog which focused on AUD spreads is equally applicable to the USD case. This problem arises from the fact that LIBOR is set in advance and the compounded RFR is only known in arrears.
This difference in timing is important especially in times of large and unexpected changes to FED Target Rate. LIBOR is unlikely to predict the rate change and so the spread can be well away from the median for a period of time.
This feature of the fallback spread calculation can lead to a potential step at the time of LIBOR cessation. If markets are volatile at that time, with no transition time, there could easily be a significant change in rate and cashflows for derivatives and cash products.
Current spread and projection
The following charts show the spread for USD since January 2020 for 1 and 3-month LIBOR. Note that the 1 and 3-month compounded SOFR are on the final rate fix date and LIBOR is therefore forward-shifted moved 1 or 3 months to align with SOFR and calculate the correct spread.
For example, the 1 month LIBOR is moved forward 1 month.
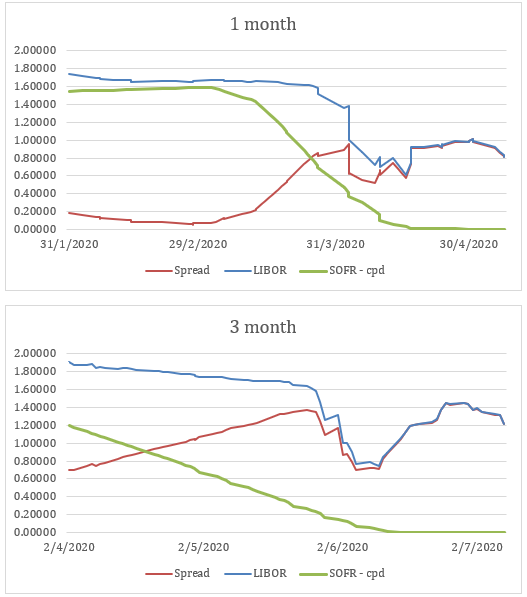
In both cases, I have extrapolated the SOFR rate (as published by NY FED, currently 0.01%) out 1 and 3 months. This assumes no further changes in Target Rate (which may be incorrect) but illustrates how the spread can evolve over the next months.
Both charts show that the spread has widened for the first 2/3 of the chart. This is entirely consistent with the rate expectations until the end of February (no easing) which were reflected in LIBOR (on the charts 31/3/20 and 28/5/20 respectively due to the 1 and 3-month shift)
After this the spread falls as LIBOR adjusts to the new rate expectations but rose again as LIBOR pushed out mid-March. The LIBOR behavior is entirely consistent with historical performance.
SOFR is a relatively smooth curve as the step falls in the FED Target Rate are gradually included in the compounded SOFR. Note that compounded SOFR falls to zero (by early April in the 1-month and early June in the 3-month chart) which assumes SOFR continues to set at the current level approximately 0.01%
But LIBOR actually rose in late March and so the extrapolated spread (e.g. the 3-month Libor at the end of March minus the extrapolated compounded SOFR) widens.
Since early April 2020 the chart shows a gradual narrowing of the spread as LIBOR falls to more ‘normal’ levels after the initial liquidity squeeze.
It is important to note that this outcome is very likely assuming SOFR sets at around 0.01% (no further FED moves). The LIBORs are already set so will persist for 1 – 3 months into the future spreads.
What does this imply?
The projected 1-month spread is expected to stay at approximately 80-100 bps for at least the end of April.
The 3-month spread is actually projected to rise gradually to 140 bps until the end of May, fall to around 80 bps and rise again to 140 bps by the end of June 2020. After June, the spread will likely fall in line with the current falls of LIBOR in early April.
These spread levels are much higher than the 5-year median spreads proposed for fallbacks. The current 5-year spreads are in the following table:
| Tenor | 5-year median |
| 1-month | 10 bps |
| 3-month | 25 bps |
If LIBOR was discontinued now or over the next few months, then the fallback spread would be significantly lower than the current spread or that projected over the next few months.
When the 5-year median spread is added to the compounded SOFR, the resulting ‘all-in’ benchmark rate would be much lower than LIBOR.
The valuation of the products that reference LIBOR that would suddenly change with potentially significant implications for many participants.
Past Spreads
The spread has been quite volatile over the past 5 years. The following charts using the Charm IBOR Transition Tools show the implied spread for the past 5 years.
Please note that the SOFR rates are those calculated by NY FED from available data as SOFR was not available in its current form before April 2018.
As previously noted, the spread is LIBOR (looking back 1 or 3 months) minus the compounded SOFR over 1 or 3 months. This combination of forward-looking rates (LIBOR) and backward-looking rates (compounded SOFR) tends to make a volatile data series.
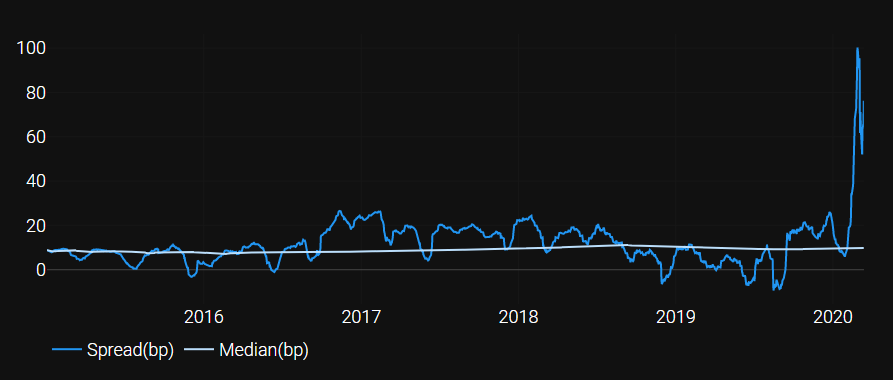
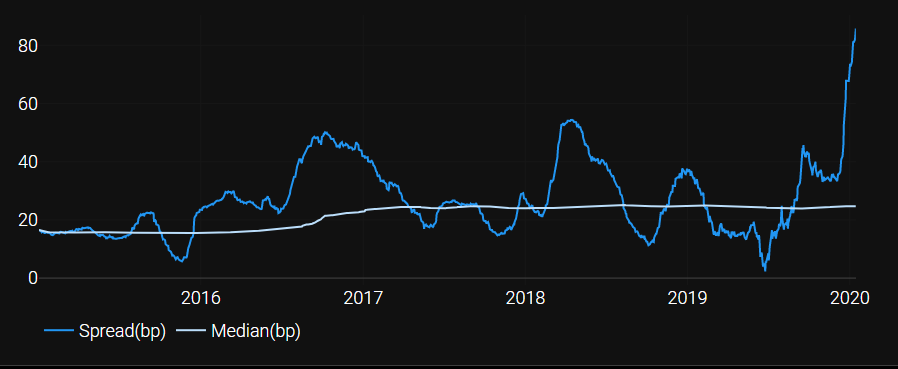
The data set for the spread is quite volatile with peaks and troughs. In some cases, in the 1-month chart the spread is actually negative!
In both cases, the spread can be very different to the 5-year median and for both we see a massive increase in Feb-2020 due to the Covid-19 pandemic. For 3-month, the spread has shot up from +35bps before the pandemic to +85bps now, while 1-month has shot-up from +10bps to +76bps.
Infact if we set our start date to 1-Jan-2017, we have just over 3 years of crystallized spread and just under 2 years to go to Jan-2022, and in the unlikely hypothetical scenario that the current 3-month spread of +85bps persists till Libor cessation, then our current median of +25 bps could rise as high as +46 bps!
The current spread diverging so far from the median can become quite important for valuations and hedge effectiveness for some participants. A sudden change to expected cashflows could be very disruptive to accounting and valuation models.
Transition period?
Should there be a transition period for all products as recommended by the ARRC for consumer products?
There is an argument for such a transition period to allow for the spread to gradually return to the 5-year median rather than have a sudden step from LIBOR to a different rate based on the fallbacks.
If the market approaches the LIBOR cessation date (currently the end of 2021) with volatile conditions and/or a market crisis then LIBOR may not necessarily behave rationally and be close to the compounded SOFR plus the 5-year median spread.
LIBOR may rise as it has in March 2020. This may happen because LIBOR is not actually linked to the fallbacks – it will move to where the market perceives it to be!
And in some cases (e.g. rising FED Target Rates) the spread can be negative.
A transition period could ease the sudden step if LIBOR is not equal to the fallbacks at cessation.
Summary
The recent volatility in markets has shown how much the current LIBOR/fallback spreads can differ from the 5-year median which has (or will be) broadly adopted by markets and products.
LIBOR can, and does, react to market conditions and expected changes in FED Target Rates. LIBOR is forward-looking and anticipates rate changes as well as credit and liquidity inputs. It is quite different to compounded SOFR which is backward-looking and is a calculation of what actually happened.
If we arrive at the date of LIBOR cessation with a very different LIBOR to that implied by compounded SOFR plus the spread then there will be a step up or down in the benchmark rate applied to rate fixings.
This could have significant impacts on users of LIBOR and its replacement.
The transition period recommended by the ARRC for consumer products could also be considered more broadly to address this possibility.
Of course, LIBOR could behave rationally in the lead up to LIBOR cessation and revert to the no-step value. But it may not: and that depends on market conditions at the time.