Given the recent increases in initial margin that I covered in a few recent blogs (see Procyclical margins in the time of Covid-19 and Crashing rates and swap margins), I wanted to look into backtesting of margin models.
Background
Backtesting is a well established practice, widely used by all CCPs to check the adequacy of margin cover and by Banks for adequacy of capital required for market risk.
In a nutshell it checks the daily VM (or PL) observed over time for an account is less than the Initial Margin held for that account and quantifies the number of times that it is higher.
The output of a backtesting run looks something like this.
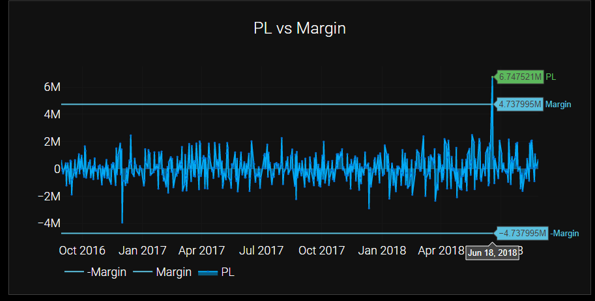
The squiggly line is the PL, in our case daily, over a time period from Oct 2016 to Sep 2018, while the horizontal line is the Initial margin, in this case $4.7 million.
There is one date, Jun 18, 2018 where the PL of $6.7 million exceeds the initial margin.
Margin period of risk (MPOR) refers to the number of days of market risk that initial margin is calibrated too and the PL should be over the same period. Typically CCPs use 1 or 2 days for Futures and 5 days for Swaps, while Uncleared Margin Rules (UMR) require 10-days.
Evaluating a Backtest
From the backtesting results, we need a few simple measures that tell us something about the soundness of the margin model:
- the number of exceptions
- the number of observations
- the amount that the largest exception is in excess of margin
In our example, these are 1, 250 and $2 million.
Then given our design of the margin model and in particular the confidence level, we could assess if the model was adequate and passes the backtest or not.
Foe example for a 99% confidence level value-at-risk (VaR) model, we expect on average 1 out of 100 days to have an exception, so the above backtest result would pass, while 4 or more exceptions would cause as to doubt the adequacy of the model.
Note that using VaR as the metric for margin does not state anything about how large the exception could be beyond VaR, it could be 110% of VaR or 300% of VAR! This is where tail measures like Expected Shortfall (ES) are better as they account for the long tails we see in financial time-series data.
Basel II & III for Banks requires the use of a statistical traffic light test with green, amber & red zones for backtesting results, details of which can be found in the BCBS document “Minimum capital requirements for market risk” (January 2019).
CCP Quantitative Disclosures
For CCPs, we can turn to Quantitative Disclosures in CCPView for insights into backtesting results (Disclosures 6.5.n). Let’s do so for a few selected clearing services.
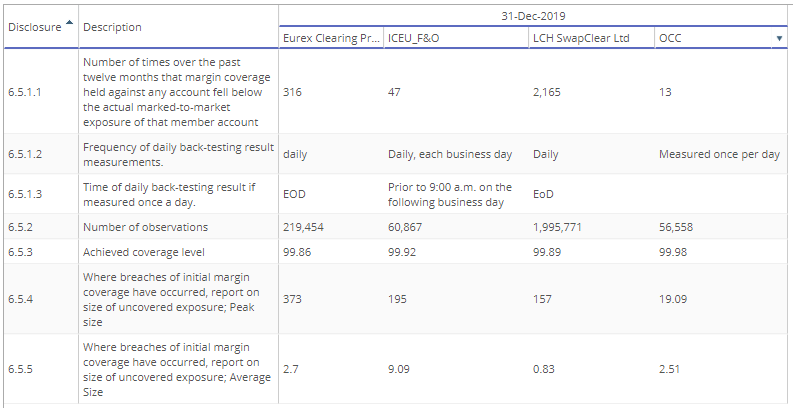
- Eurex Clearing Fixed Income, shows 316 exceptions over the past 12 months on any account, out of a total of 219,454 observations, a coverage level of 99.86% and a peak uncovered exposure of $373 million
- LCH SwapClear, shows 2,163 exceptions, 1,995,771 observations, a coverage level of 99.89% and a peak uncovered exposure of $157 million.
Note: Coverage level is defined as 1 – (6.5.1.1/6.5.2) expressed as a percentage, where 6.5.2 is the number of observations and 6.5.1.1 the number of times cover fell below mark to market exposure.
As the number of accounts are very different for each clearing service (e.g. LCH SwapClear has >23,000 client accounts) and the 6.5.1.1 exceptions are over all the accounts, comparing the absolute exceptions between CCPs needs to be done carefully.
However the coverage level and size of uncovered exposure are directly comparable and show less variance between CCPs, which is what we would expect and be concerned by CCP results that were outliers.
It will be very interesting to see how these numbers change for 31-Mar-20, when we get these disclosures in early July.
I am sure CCPs themselves have a lot more backtesting results data and share some of that with members on their risk committees, possibly including the Green, Amber, Red Zone type tests.
Margin Models
In addition disclosures 6.4.n provide details to compare IM models, lets do so for the same four clearing services above.
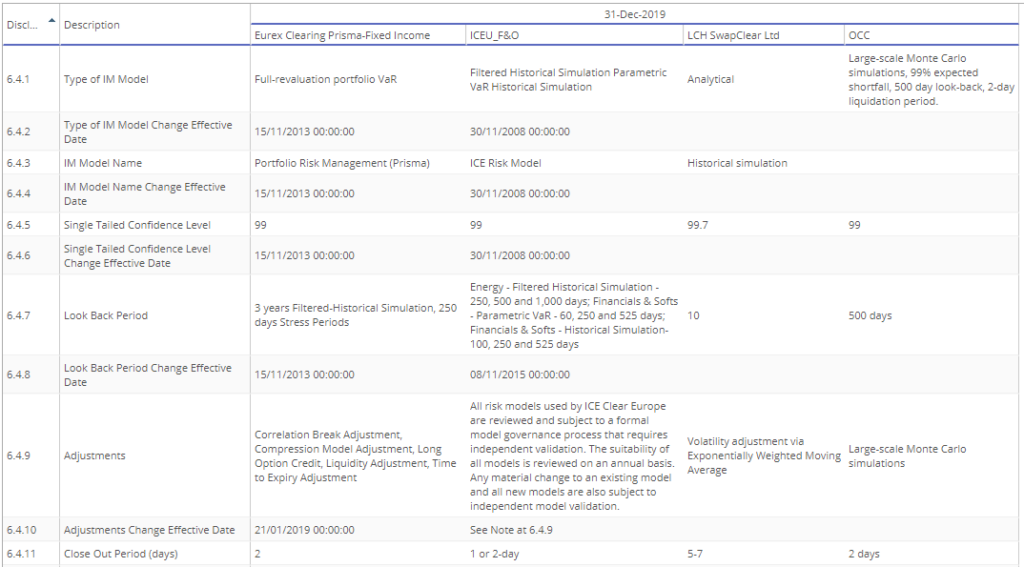
- Three of these use Historical Simulation and one Monte-carlo Simulation
- Confidence levels used are 99% or 99.7%
- Look back periods vary from 500 days to 10 years, with Eurex noting the use of Stress periods
- Close out period (MPOR) is either 1-day, 2-days, 5-days or 7-days.
- No consistent disclosure on if VaR or ES is used, though OCC mention ES in 6.4.1
I am sure all these models are well calibrated and perform well in backtesting.
The real value in the disclosures is comparing across many CCPs for differences or outliers and questioning these with the CCPS risk committees, as well as noting changes over time.
The End
That’s all for today.
Backtesting is important for margin models.
It provides the confidence that initial margin is adequate.
The coverage level (exceptions/observations) is important.
So is largest uncovered exposure.
CCPView has disclosures for 36 Clearing Houses with many more CCPs.
Covering Backtesting, IM models and more.