- ISDA SIMM v2.4 is effective December 4, 2021
- Updated with a full re-calibration and industry backtesting
- Including for the first time the Covid-19 Crisis time period
- Meaning Initial Margin will increase for most portfolio
- To quantify the actual impact of SIMM v2.4
- CHARM can run SIMM v2.4 and v2.3 on your portfolios
- And do so before go-live, to pre-empt and be proactive
Version 2.4
ISDA has published ISDA SIMM v2.4 with a full re-calibration of risk weights, correlations and thresholds. The calibration period is a 1-year stress period (2008 Great Financial Crisis) and the 3-year recent period ending Dec 2020.
This means that Covid-19 market volatility in February/March 2020 has now been included in SIMM v2.4 while its was not included in SIMM v2.3 calibration. While SIMM is designed with low procyclicality in mind, the impact of the Covid-19 stress period on top of the 2008 Great Financial Crisis period, means more volatility in the calibration set, which will invariably result in higher risk weights for many risk factors; higher weights mean higher SIMM IM.
CHARM
Clarus customers using CHARM or Microservices are able to easily run SIMM v2.4 and compare the margin with SIMM v2.3 for their actual or hypothetical portfolios; as in the example below.
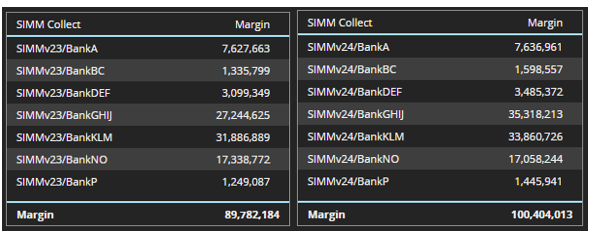
- The total gross margin increasing from $90million to $100 million
- An increase of 12% for the total Margin, significant indeed
- Changes at the counterparty portfolio level are more important
- And these can show a wide variation
- BankGHJ increasing from $27m to $35m, a 30% increase
- (Drill-down would show this increase is from Credit and Equity product classes)
- Most portfolios with >10% increases
- Only one portfolio with a decrease and that only 2%
Not surprisingly the materiality of the change in IM depends on the risk factors in the portfolio and this change can be a large or small, increase or a decrease.
The only way to really know is to calculate SIMM v2.4 on your actual portfolios and compare results, which CHARM makes it easy to do, months before the actual change when the market switches to SIMM v2.4 on December 6, 2021. Foresight is forewarned and allows for better planning of collateral requirements and opens up the potential of pre-emptive actions.
It is possible to eyeball the new risk weights, correlations and thresholds in SIMM v2.4, compare to SIMM v2.3 and highlight a few of the more obvious impacts on margin.
SIMM v2.4 cf v2.3
Let’s do that by risk class.
Foreign Exchange risk
- ARS, BRL, MXN, TRY and ZAR are now high volatility currencies with a risk weight of 13
- While in SIMM v2.3 there were no high volatility currencies, only regular with a risk weight of 7.5
- Meaning that NDF and FXOs in these four currencies will have almost double IM in SIMM v2.4
- Vega risk weight has increased from 0.30 to 0.47, a greater then 50% increase
- Again making FXO IM much higher
Interest Rate risk
- Cross currency basis swap spread risk weight is 21 down from 22.
- Inflation risk weight is 64 up from 50, so 28% higher IM for Inflation swaps.
- Vega risk weights 0.18 vs 0.16
- Interest rate risk weights are categorized into regular, low and high volatility currencies and within these tenor buckets. The picture here is mixed, with some higher and some lower, as an example risk in the benchmark 10-year tenor is little changed, while the 20-year tenor is higher in USD (54 to 60), un-changed in JPY (20) and higher in MXN, HUF, THB (100 to 104).
- For full details please see the SIMM v2.4 and SIMM v2.3 documentation.
Equity risk
- Equity risk weights are higher for all buckets, generally >15%, with smaller equities (<$2b) up 27%
- The vega risk weight is now 0.50, up from 0.26, while bucket 12 (vol indices) is 0.98 from 0.67
- So much higher IMs for Equity TRS and Options
- Correlations higher for all buckets
Commodity risk
- Crude up from 20 to 29, Light Ends 23 to 33, Freight 39 to 53
- Only North American Power (57 to 49) and Grains (15 to 13) materially lower
- Vega risk weight is up to 0.61 from 0.41, so higher margin for volatility products
- Higher IMs for most commodities and options
Credit Qualifying risk
- Risk weights for Investment Grade sectors all higher, particularly Basic materials, energy, industrials up from 68 to 86, an increase of 26%
- Risk weights for High Yield sectors all higher, most by 15% to 30%, but again Basic materials, energy, industrials standing out with a 77% increase and Technology, telecommunications with a 53% increase
- Residual risk weight up to 452 from 333, so up 36% and it was 250 in v2.2
- Vega risk up to 0.73 from 0.46
- A lot higher IMs for most CDS and Swaptions
Credit Non-Qualifying risk
- Risk weights for Investment Grade RMBS/CMBS are up to 280 from 240 and 100 (in v2.2)
- Risk weights for High Yield RMBS/CMBS are up to 1,200 from 1,000 and 1,600
- All other buckets up to 1,200 from 1,000 and 1,600
- Significant changes in correlations
Concentration Thresholds
Concentration thresholds increase SIMM for large concentrated portfolios and I am out of time to summarize these, suffice to say some have decreased (Large Cap Developed Market Equities) and others have increased (Crude Oil). Decreases mean IM increases quicker, while increases mean IM increases later.
For full details please see the SIMM v2.4 and SIMM v2.3 documentation.
That’s It
SIMM v2.4 has all new risk weights and correlations.
We provide a summary of the risk weight changes.
Equities, Credit and Commodity risk with significantly higher IM.
Vega and Options also higher IM.
To get an accurate understanding of IM change.
You need to run SIMM v2.4 on your existing portfolios.
CHARM and Microservices provide an easy way to do this.
Contact us if you are interested in this exercise.
Certainly worthwhile with just over two months to go.
As most portfolios will attract higher IMs.