
We estimate Q2 2026 FX IM optimization (IMO) hedge volumes and market share, based on US-reported daily NDF volumes sourced from SDRView.
Key takeaways
Q2 2026 estimates indicate that:
- Year-on-year (YoY) the Thursday vendor moved into a leading market share of FX IMO hedge volume by taking 11% from the Tuesday vendor, while Capitolis gained 6% in its first year of operation.
- FX IMO vendor runs generated $1.05 trillion of deliverable pair NDF trade notional – up 11% YoY but 22% below the Q3 2025 peak.
- FX IMO-generated deliverable pair NDFs volumes set a record $93 billion in the Thursday 25 June 2026 run – up 46% from the recent peak run set on Thursday 7 August 2025.
If Capitolis can overcome its late mover disadvantage, it should expect further market share gains from LSEG (London Stock Exchange Group) and OSTTRA.
Background
If you are not yet aware of this niche topic, please refer to my prior blog on FX IMO which covers the following:
- FX options and NDF trading drive SIMM FX IM and ForexClear IM which prompted FX IMO vendors to start operating in 2015.
- FX IMO vendors and participants minimize SIMM FX IM and ForexClear IM by executing NDFs.
- Deliverable pair NDF daily activity plots show us regular weekly FX IMO run patterns (and non-deliverable pairs tell us much less).
- LSEG and OSTTRA have organized weekly FX IMO runs on Tuesdays or Thursdays for many years, though which vendor has which day is not public.
- Capitolis started to organize FX IMO runs about a year ago, running either on Monday or Wednesday each week.
- We estimate FX IMO volumes and vendor market shares by adjusting off-platform NDF volumes aggregated by weekday.
While sparing you a Q2 redo of the charts in that blog, I can confirm that the daily patterns described continued in Q2 2026. So, we base this blog on the same assumptions and estimating approach.
While FX IMO vendor runs lower IM, the IM reduction amounts are private except for the occasional vendor press release. However, I expect a meaningful correlation between the total IM reduction across participants and the total NDF notional volumes across participants (which we proxy from the deliverable pairs subset of that volume).
FX IMO-generated non-deliverable pair NDFs
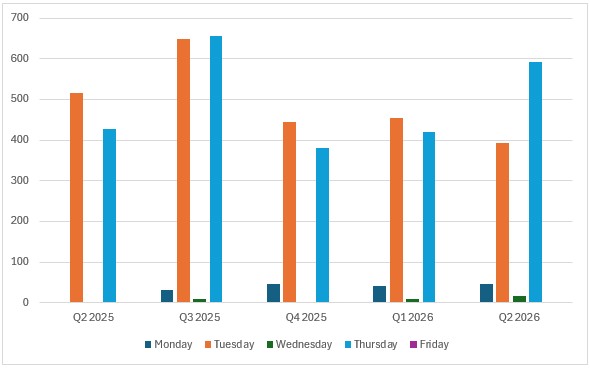
Chart 1: US-reported FX IMO run deliverable pair NDF volume by weekday (notional USD billions). Source: SDRView
Q2 2026 total FX IMO run deliverable pair NDF volume was $1.05 trillion – up 11% YoY but down 22% from the Q3 2025 high of $1.35 trillion.
- The Tuesday vendor volumes were $393 billion – down 24% YoY and down 39% from the Q3 2025 high of $649 billion.
- The Thursday vendor volumes were $592 billion – overtaking the Tuesday vendor and up 38% YoY and but down 10% from the Q3 2025 high of $656 billion.
- The Monday and Wednesday runs combined (assumed Capitolis) were a new high of $60.7 billion – up YoY from almost zero and up 22% from the Q1 2026 high of $49.8 billion.
- Friday was zero – consistent with no vendor runs.
We recast the same figures as market share percentages.
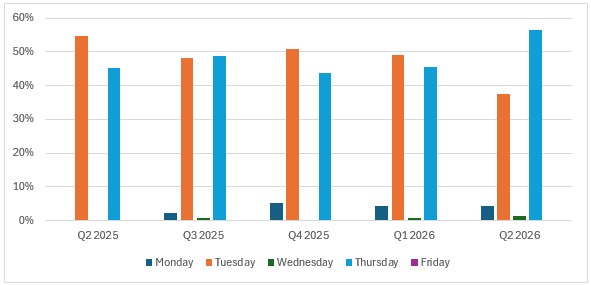
Chart 2: weekday shares of US-reported FX IMO run deliverable pair NDF volume (percentage of USD notional). Source: SDRView
Chart 2 shows the following Q2 2026 shares:
- The Tuesday vendor share was 37.6% – down 17.0 points YoY and down 11.6 points quarter-on-quarter (QoQ).
- The Thursday vendor share was 56.6% – up 11.4 points YoY and up 11.2 points QoQ.
- The Monday and Wednesday runs combined (Capitolis) took 5.8% – up 5.8 points YoY and up 0.4 points QoQ.
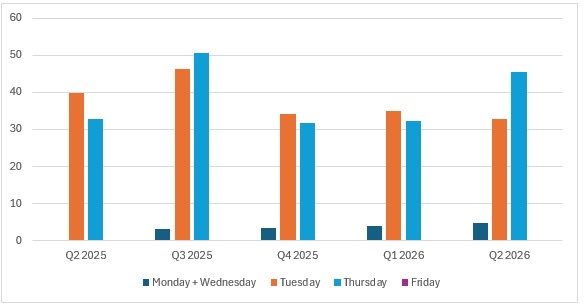
Chart 3: average FX IMO run deliverable pair NDF volume by weekday (USD notional). Source: SDRView
Chart 3 shows Q2 2026 average FX IMO run deliverable pair NDF volumes. Note: I created these averages by dividing the totals in chart 1 by counted numbers of each weekday in each quarter.
- The Tuesday vendor had an average of $32.8 billion – down 17% YoY and down 29% from the Q3 2025 high of $46.4 billion.
- The Thursday vendor had an average of $45.6 billion – up 38% YoY but down 9.7% from the Q3 2025 high of $50.5 billion.
- The Monday and Wednesday vendor (Capitolis) had an average of $4.67 billion – up from almost zero YoY and up 20% from the Q1 2026 high of $3.88 billion.
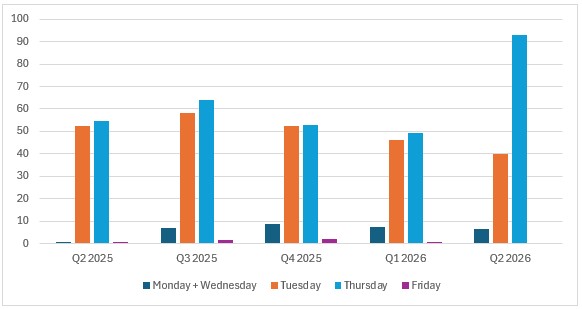
Chart 4: each quarter’s peak FX IMO run deliverable pair NDF volume by weekday (USD notional). Source: SDRView
Chart 4 shows the following Q2 2026 peak FX IMO run deliverable pair NDF volumes:
- The Tuesday vendor had a peak run of $39.9 billion on Tuesday 19 May – down 24% YoY and down 31% from the Tuesday 30 September 2025 recent peak run of $58.2 billion.
- The Thursday vendor had a peak run of $93.1 billion on Thursday 25 June – up 70% YoY and up 46% from the Thursday 7 August 2025 recent peak run of $63.8 billion.
- The Monday and Wednesday vendor (Capitolis) had a peak run of $6.67 billion on Monday 27 April – up from almost zero YoY but down 23% from the Monday 10 November 2025 peak run of $8.7 billion.
- In summary, the figures show the entrance of Capitolis over the last year or so and a much bigger shift in volume market share and peak run size from Tuesday vendor to the Thursday vendor.
Weekly run scheduling
A bank dealer usually trades fewer currencies in rates swaptions than they trade currency pairs in FX options and NDFs, so more IM balances change every day in FX than in rates. This is one reason IMO vendors each schedule one main rates run per month while they each schedule one FX run per week.
In the real world, participation is the most important driver of results. If an entity participates with one or two of the three vendors, the vendor run(s) it skips will not receive counterparty risk positions between that entity and all the participants in the run. However, run scheduling considerations also influence results. It is easier to discuss run scheduling impacts if we assume all participants join all three vendor runs each week.
Consider an FX option or NDF trade executed after the last FX IMO run cutoff for any vendor. The next vendor run will have the first chance to optimize its risk with on average more likelihood of success than subsequent vendor runs. Now, scale up this thought in your head to whole days of FX option and NDF activity. Before Capitolis launched FX IMO in 2025, a Tuesday vendor run had three days’ new activity (from the prior Thursday, Friday, and Monday), while a Thursday vendor run had two days’ new activity (from the prior Tuesday and Wednesday).
When Capitolis launched its FX IMO, it could have avoided clashing with the incumbent vendors by choosing to run on Mondays, on Wednesdays, or on Fridays. Since it has never run on that day, I suppose Friday was an unpopular run date with Capitolis participants – maybe because participants’ T+1 controls require Saturday work or remain incomplete over the weekend. The other days have the following numbers of days of new activity:
- Monday: Capitolis two, Tuesday vendor one, Thursday vendor two. This favors Capitolis and limits the Tuesday vendor.
- Wednesday: Tuesday vendor three, Capitolis one, Thursday vendor one. This favors the Tuesday vendor and limits the Thursday vendor.
It is not hard to see why Capitolis would prefer Monday, but a Wednesday choice also gives a more unbalanced three-way split. In theory, a more even average split of activity days over time would occur if Capitolis ran on Monday in most weeks and Wednesday in a minority of weeks.
Despite its run schedule, Capitolis market share is not yet close to the other two vendors. Can the incumbent vendors hold onto their early mover duopoly or will Capitolis grow its market share towards parity? Will the Thursday vendor increase its lead, or will the Tuesday vendor make a comeback?
To stay close to developments, we will produce this blog quarterly going forward.
That’s it
Flip back to the top to recap the key takeaways.
The new daily volumes of NDF by currency pair and product type used in this blog (and a lot more besides) are available in SDRView researcher and CCPView. Click each of those links to see a summary of the range of data available.
Contact us if you are interested in a subscription.