Capitolis has launched multilateral FX initial margin optimization (IMO) runs, taking on the long-standing FX IMO services of LSEG and OSTTRA. Word of the launch came in while I was working on this update on Clarus volumes related to FX IMO. The successful entrance of new vendors always adds interesting new angles to this type of research.
All data are sourced from SDRView and CCPView.
Key takeaways
In Q1 2026, FX IMO runs generated $924 billion notional of deliverable pair NDF trades – up 13% YoY.
We aggregated and adjusted volumes to estimate shares of FX IMO run deliverable pair non-deliverable forwards (NDF) volumes. For Q1 2026 these gave:
- 5.4% to Capitolis – up from zero YoY.
- 49.1% to the Tuesday vendor – down 7.9 points YoY.
- 45.4% to the Thursday vendor – up 2.5 points YoY.
While not yet challenging the FX IMO duopoly of LSEG (London Stock Exchange Group a.k.a. Quantile) and OSTTRA (a.k.a. TriBalance), Capitolis has taken a 5% share. Its share may increase further through cross-selling established FX capital optimization and rates IMO participants among other sources.
Background
When Capitolis confirmed they had started FX IM optimization runs, I knew this would liven up my follow up to FX IM optimization and ISDA SIMM FX Optimization and NDFs. Their move is a natural response to the expansion of OSTTRA and LSEG FX IMO services a few years ago to add FX capital optimization, a market previously uniquely owned by LMRKTS which was acquired by Capitolis in 2021.
The blogs linked above established regular pattern of weekly runs from LSEG and OSTTRA – one every Tuesday and the other every Thursday. Note that it is not public information which vendor runs on which day.
Understandably, Capitolis declined to confirm specific run dates and volumes. Please carefully note the estimating assumptions outlined below.
To avoid forcing a re-read of the blogs above, I recap:
- SIMM FX IM and ForexClear IM arise mainly from FX options trading in deliverable pairs and NDF trading in non-deliverable pairs.
- FX IMO vendors produce NDFs in bulk on run days to hedge SIMM FX IM and ForexClear IM.
- The deliverable pair NDFs they generate stand out in the volumes given little purpose other than to hedge SIMM FX IM and ForexClear IM.
- The non-deliverable pair NDF volumes cannot easily be split between regular trading and FX IMO hedge volumes.
Deliverable pair NDF volume patterns
Firstly I present dated samples of the weekly spike-day patterns shown in the prior blogs, starting with US-reported trades.
Day-by-day US-reported deliverable pair NDF volumes (notional USD billions). Source: SDRView
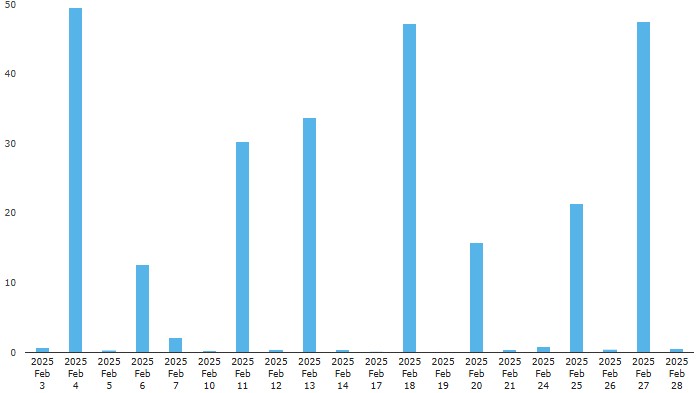
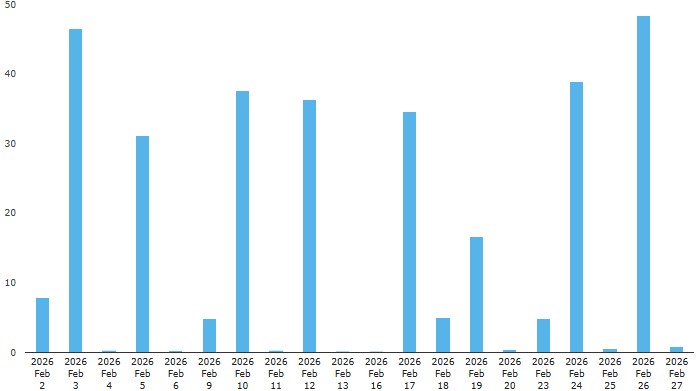
Chart 1: February 2025
Chart 2: February 2026
Along with the long-standing pattern of Tuesday and Thursday volume spikes in both charts, February 2026 shows four “new” spike-days on Monday or Wednesday between $5 and $10 billion. Though much smaller than the Tuesday and Thursday spike-days, they stand out from the much lower volumes on other days. The new pattern started in Q3 2025 (visible to SDRView subscribers).
Now we look at cleared deliverable pair NDF volumes.
Day-by-day cleared deliverable pair NDF volumes (notional USD billions). Source: CCPView
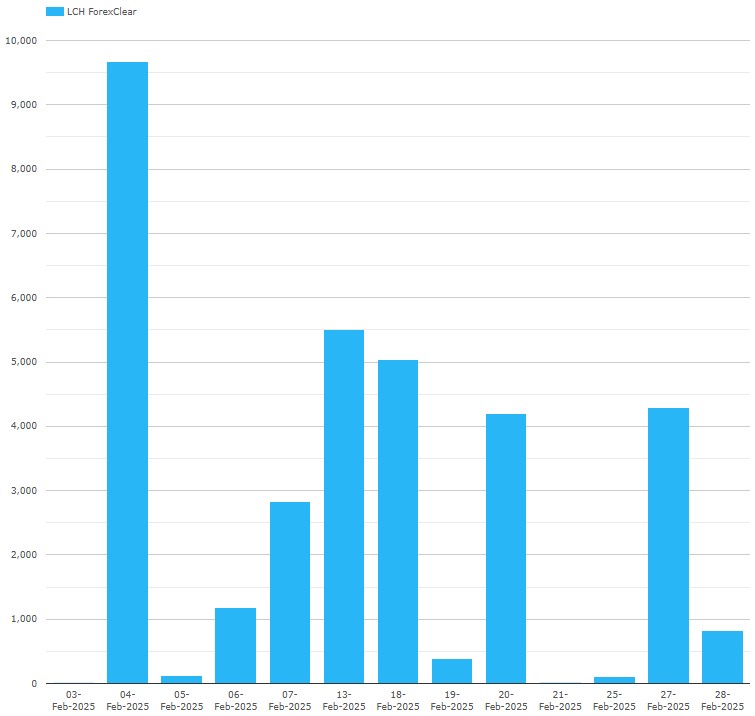
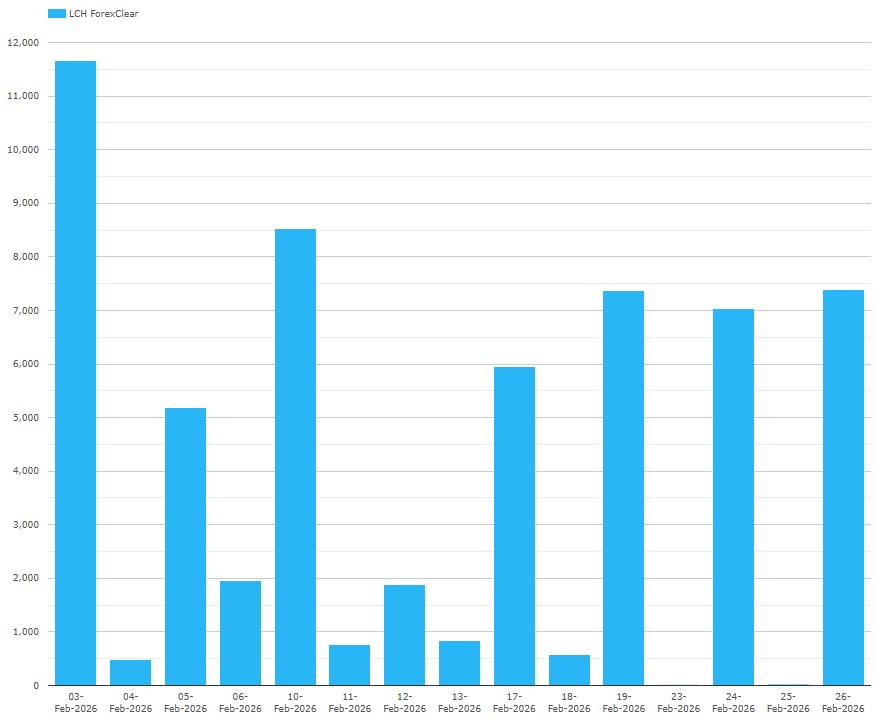
Chart 3: February 2025
Chart 4: February 2026
Charts 3 and 4 show much smaller deliverable pair NDF volumes than the US-reported view (which includes maybe half the cleared trades along with many more uncleared trades). This is understandable given FX IMO runs’ natural focus on FX SIMM IM which is much larger than cleared FX IM.
The charts show a less obvious Tuesday and Thursday spike-day pattern which is clearer in February 2026 than in February 2025. They also do not show obvious spike-days corresponding to the Monday and Wednesday spikes noted in Chart 2. One reason the charts are less easy to interpret may be that it is possible to effect clearing novation to ForexClear on a later date than trade date.
As CCP volumes are a small fraction of the total NDF activity, and are partially included in US-reported data, we use only US-reported data to assess FX IMO market shares.
Estimating FX IMO volumes and market share
Given only deliverable pair NDFs show a clear enough pattern to split FX IMO driven activity from other activity, we use these as a proxy for the total FX IMO hedge volumes when calculating market share. I acknowledge that FX IMO generated volumes of non-deliverable pair NDFs can be larger and may be split differently by vendors. Nonetheless, I expect market share shifts calculated from non-deliverable pairs to be directionally consistent with those which might be produced from a global total of both deliverable and non-deliverable pair NDFs, if this were possible.
Looking across the five quarters from Q1 2025 to Q1 2026 (visible to SDRView subscribers), I observed consistent Tuesday and Thursday deliverable-pair NDF spike-days almost every week. One day Capitolis’ entrance may prompt changes to LSEG and OSTTRA run schedules, but not before the end of Q1 2026. Therefore, I assumed Monday and Wednesday spike-days during the five quarters resulted from Capitolis runs. I repeat for emphasis: Capitolis has not confirmed this.
Here’s how I estimated:
- I recategorized two one-off Friday spike-days to the Thursday bucketgiven the adjacent Thursday had no spike, assuming the Thursday vendor rescheduled to avoid a conflict.
- I calculated “weekday” totals per quarter meaning totals for all Mondays, all Tuesdays, all Wednesdays, all Thursdays, and all Fridays in each quarter.
- I subtracted an estimate for the tiny non-IMO activity which Icalculated as the smallest of the Monday, Wednesday, and Friday totals in each quarter. This was subtracted from all five weekday totals in the quarter. This crude but effective approach assumes the tiny non-zero activity is bilateral hedging of FX SIMM IM or ForexClear IM. After all, a risk-trader of deliverable pair FX would usually use FX forwards not NDFs to avoid incurring SIMM.
- Here are the results.
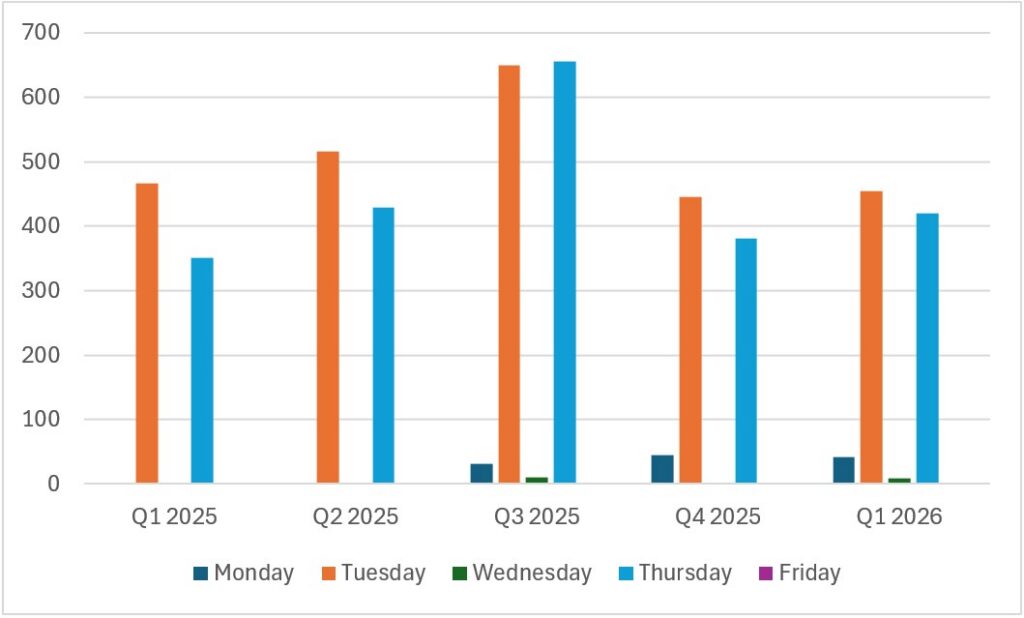
Chart 5: total US-reported FX IMO run deliverable pair hedge volume by weekday (in NDF trade notional USD billions). Source: SDRView
Chart 5 shows that Q1 2026 total FX IMO run deliverable pair NDF hedge volume was $924 billion – up 13% YoY but down 31% from the Q3 peak of $1.35 trillion.
- The Tuesday vendor runs were $454 billion – down 2.5% YoY and down 30% from their $649 billion peak in Q3 2025.
- The Thursday vendor runs closed the gap on Tuesday vendor runs with $420 billion – up 20% YoY but down 36% from their $656 billion peak in Q3 2025.
- The Monday and Wednesday vendor runs combined (assumed Capitolis) were $50 billion – up YoY from zero and their highest volumes so far.
- Friday was zero – consistent with no vendor runs.
We also see a peak of activity in Q3 2025, maybe driven at a lag by the peak in FX options trading volume in Q1 2025 (visible to SDRView subscribers).
Computing the volumes on a market share basis we have the following:
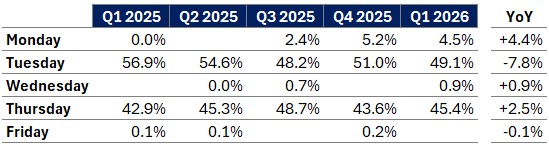
Table 1: share of US-reported FX IMO run hedge volume per weekday (percentage of adjusted total deliverable pair NDF notional). Source: SDRView
Table 1 enables comparison of FX IMO run hedge volume shares between Q1 2026 and Q1 2026 showing that:
- The Tuesday vendor runs were 49.1% – down 7.8 points YoY.
- The Thursday vendor runs were 45.4% – up 2.5 points YoY.
- The Monday and Wednesday vendor runs combined (assumed Capitolis) were 5.4% – up YoY from zero.
Competitive context
Capitolis has given LSEG and OSTTRA an eight-year head start since each launched an FX IMO service in 2017. Looking at possible progress from 5%, Capitolis’ competitive factors include participant network, algorithm, and onboarding cost. Capitolis’ existing FX SA-CCR optimization and rates IMO services can help by:
- Providing participant network building opportunities through cross-selling to their other services’ participants. Some of these date back to before LMRKTS and Capitalab was acquired in 2021 and 2024, respectively.
- Speeding up development of algorithm, participant feeds, GUI, and run-specific processes. This can be done through reuse of Capitolis and client expertise, procedures, ideas, and code from other Capitolis services.
- Speeding up onboarding through reuse or extension of existing services’ legal contracts and commercial agreements.
Capitolis may also more easily sell FX IMO to banks that invested in Capitolis in 2024: Citi, Morgan Stanley, State Street and UBS.
LSEG and OSTTRA participant inertia may make the task of reaching say 20% of FX IMO daunting. On the other hand, the Capitolis angles noted above make the task plausible.
- We will watch this dynamic closely as it further unfolds over the next few quarters.
That’s It
Flip back to the top to recap the key takeaways.
The new daily volumes of NDF by currency pair and product type used in this blog (and a lot more besides) are available in SDRView researcher and CCPView. Click each of those links to see a summary of the range of data available.
Contact us if you are interested in a subscription.