
From the end of June 2026 quarterly CPMI-IOSCO Quantitative Disclosures by clearinghouses captured by CCPView, this blog focuses on cleared IM for rates swaps, credit derivatives (CRD), and exchange-traded derivatives (ETD).
Key takeaways
The Q2 2026 disclosures show different IM dynamics across the three product groups:
- Cleared rates swaps initial margin (IM) for nine selected CCPs was (marginally) a record $375 billion – up a modest 2.6% YoY, and marginally up 0.7% from the Q1 record, consistent with the 1.1% increase in OI from Q1. Both LCH SwapClear and CME IRS disclosed record Q2 IM.
- Cleared CRD IM was $79.3 billion – up 13% YoY, but down 3.3% from the Q1 2026 high of $82.0 billion, while OI was up 1.9% from Q1. ICE Clear Credit and LCH CDSClear had similar YoY and QoQ growth rates.
- ETD IM for ten selected CCPs was a record $732 billion – up 26% YoY, and up 5.0% from the Q1 2026 high of $697 billion. The record was powered by 20+% IM growth at OCC and ICE US while IM declined at most rates ETD CCPs.
- Beyond IM we cover major OTC derivatives CCPs’ client clearing concentration disclosures (19.1) – a complement to our recent blog on FCM customer seg shares.
IM for cleared rates swaps
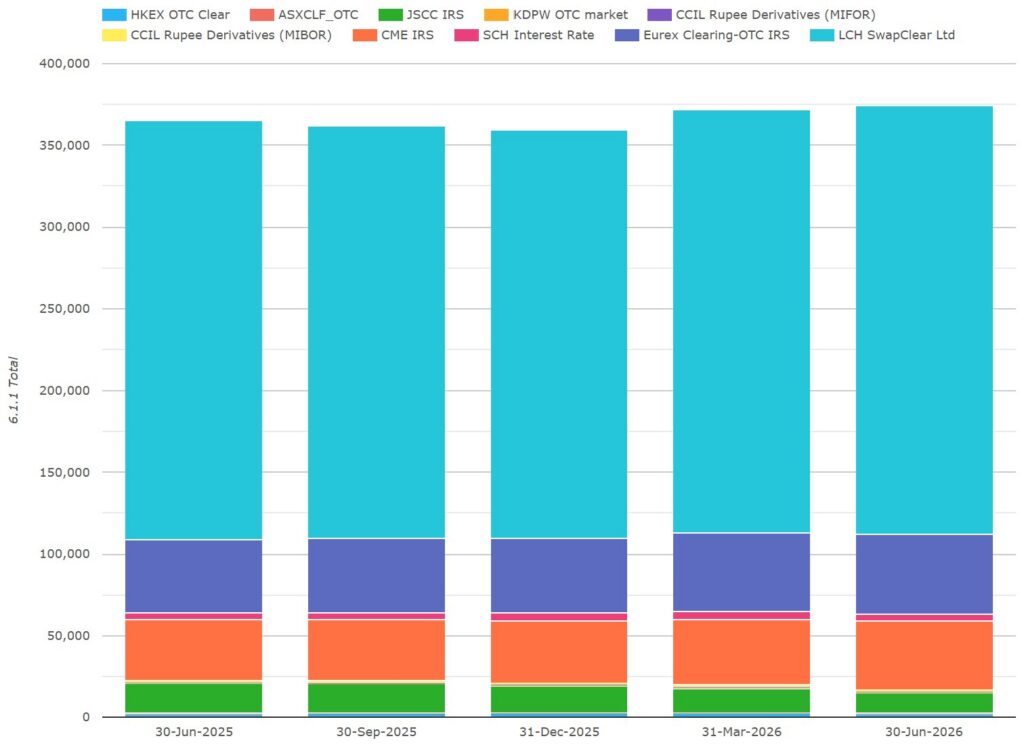
Chart 1: IRS IM by CCP ($ millions). Source: CCPView
Chart 1 includes cleared rates swaps IM from the four major CCPs (consistently 97.5+% of USD-equivalent total IM) along with the five other most material CCPs. On 30 June 2026, the selected nine CCPs combined disclosed a record $375 billion – up 2.6% YoY and up 0.7% from the Q2 2025 high of $372 billion.
- LCH SwapClear reported a record $263 billion or £198 billion – in GBP terms, up 6.2% YoY and up 1.4% from the Q1 2026 high of £196 billion.
- Eurex OTC IRS had $48.8 billion or €42.8 billion – in EUR terms, up 10.4% YoY but 28% below the end Q2 2022 high of €59.4 billion.
- CME IRS disclosed a record $41.9 billion – up 12.3% YoY and up 3.7% from the Q1 2026 high of $40.4 billion.
- JSCC IRS revealed $12.7 billion or ¥2.07 trillion – in JPY terms, down 23% YoY from the Q2 2025 high of ¥2,69 trillion.
For the four other CCPs were:
- Shanghai Clearing (from China) with $4.66 billion – up 21% YoY but 4.0% below the Q4 2025 high of $4.85 billion.
- HKEX OTCClear (from Hong Kong) with $1.90 billion – up 4.2% YoY but down 16% from the Q1 2026 high of $2.27 billion.
- CCIL (MIBOR and MIFOR combined, from India) with $1.62 billion – up 13.8% YoY but down 4.1% from the Q1 2026 high of $1.69 billion.
- ASX (from Australia) with $337 million – up 13% YoY but down 21% from the Q4 2025 high of $427 million.
- KDPW (from Poland) with $247 million – up 1.6% YoY but down 2.4% from the Q1 2026 high of $253 million.
For comparison, we show open interest (OI), also known as notional outstanding, for the big 4 CCPs over the same five quarters.
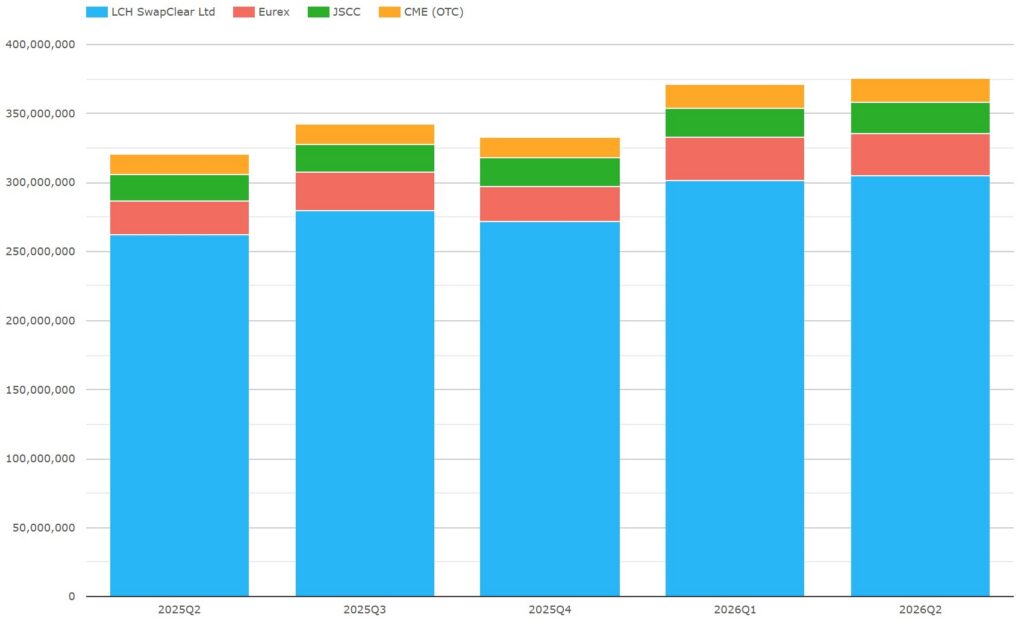
Chart 2: rates swaps OI by CCP ($ millions). Source: CCPView
Chart 2 shows that on 30 June 2026 rates swaps OI for the big four CCPs nudged up the record to $375 trillion – up 17% YoY and up 1.1% from the Q1 2026 high of $371 trillion. By CCP:
- LCH SwapClear OI was $305 trillion – up 16% YoY.
- Eurex OI was next with $31.0 trillion – up 25% YoY but down 0.4% from the Q1 2026 record of 31.2 trillion.
- JSCC OI was $22.4 trillion – up 16% YoY with the fastest QoQ increase among the four CCPs of 3.8%.
- CME OI was $17.1 trillion – up 15% YoY.
Eurex’s flat OI was flat QoQ while others grew seems to be another indicator that the volume shift from LCH from the Active Account Requirements (AAR) has leveled out.
IM for cleared CRD
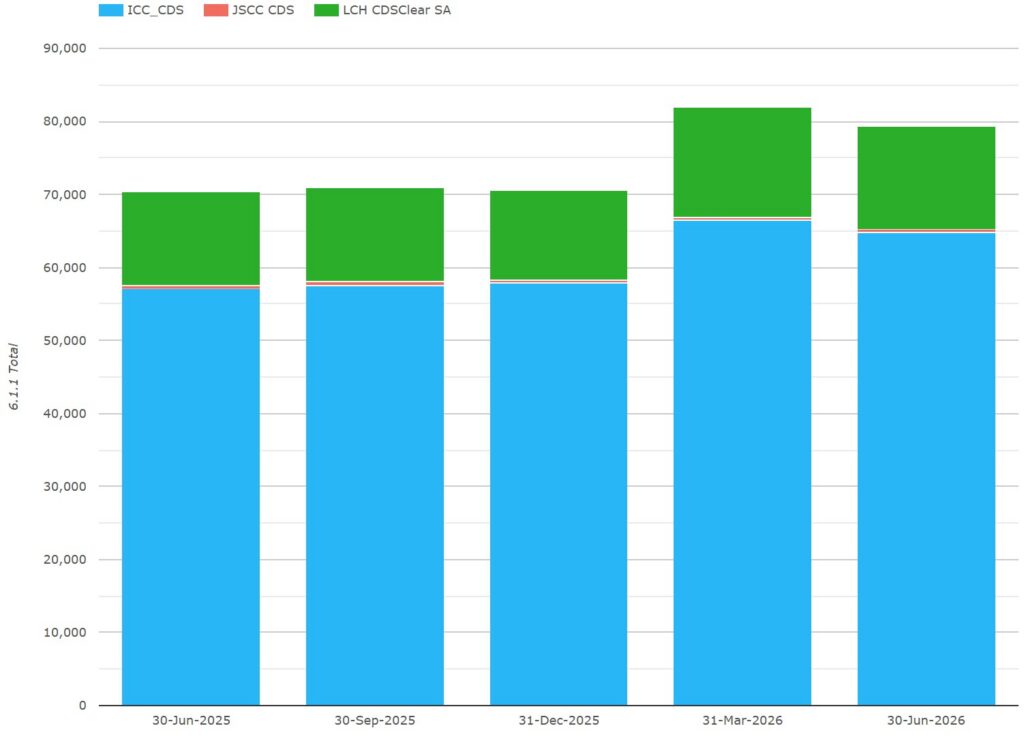
Chart 3: CRD IM by CCP ($ millions). Source: CCPView
Chart 3 illustrates that IM at major CRD CCPs was $79.3 billion on 30 June 2026 – up 13% YoY but down 3.3% from the Q1 2026 high of $82.0 billion.
- ICE Clear Credit (ICC_CDS) disclosed a record $64.9 billion – up 14% YoY but down 2.3% from the Q1 2026 high of $66.4 billion.
- LCH CDSClear reported $14.1 billion or €12.4 billion – in EUR terms, up 12% YoY but down 6.8% from the Q1 2026 high of €13.3 billion.
- JSCC CDS reported $374 million or ¥60.8 billion – in JPY terms down 3.5% YoY and well below the Q1 2020 peak of ¥184 billion (not shown).
ICE Clear Credit and LCH CDSClear had similar YoY and QoQ growth rates.
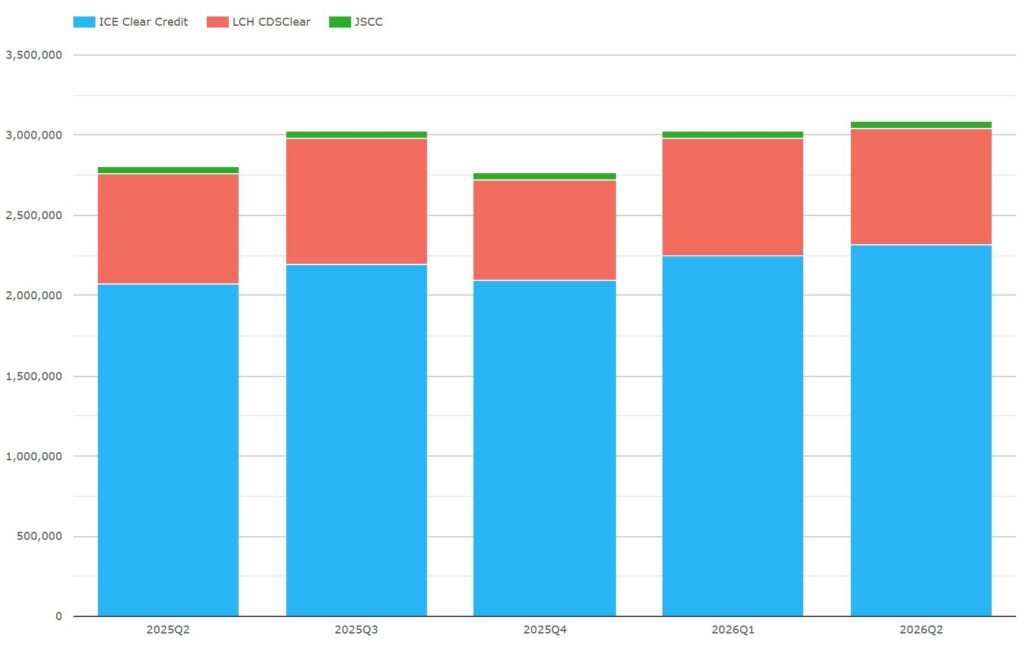
Chart 4: CRD OI by CCP ($ millions). Source: CCPView
Chart 4 shows that CRD OI (open interest or notional outstanding) at the end of Q2 2026 was (marginally) a record $3.08 trillion – up 10% YoY and up 1.9% from the Q1 2026 high of $3.03 trillion.
- ICE Clear Credit OI was a record $2.32 trillion – up 12% YoY and up 3.3% from the Q1 2026 high of $2.25 trillion.
- LCH CDSClear OI showed $720 billion – up 4.9% YoY but down 8.2% from the Q3 2025 high of $785 billion.
- JSCC OI saw $44.4 billion – down 2.3% YoY and down 3.5% from the Q3 2025 high of 46.0 billion.
I won’t include another chart, but I will pass on that ICE’s global shares of CRD OI and IM have leveled off with percentages in the 70s and the low 80s, respectively.
IM for ETD (all asset classes)
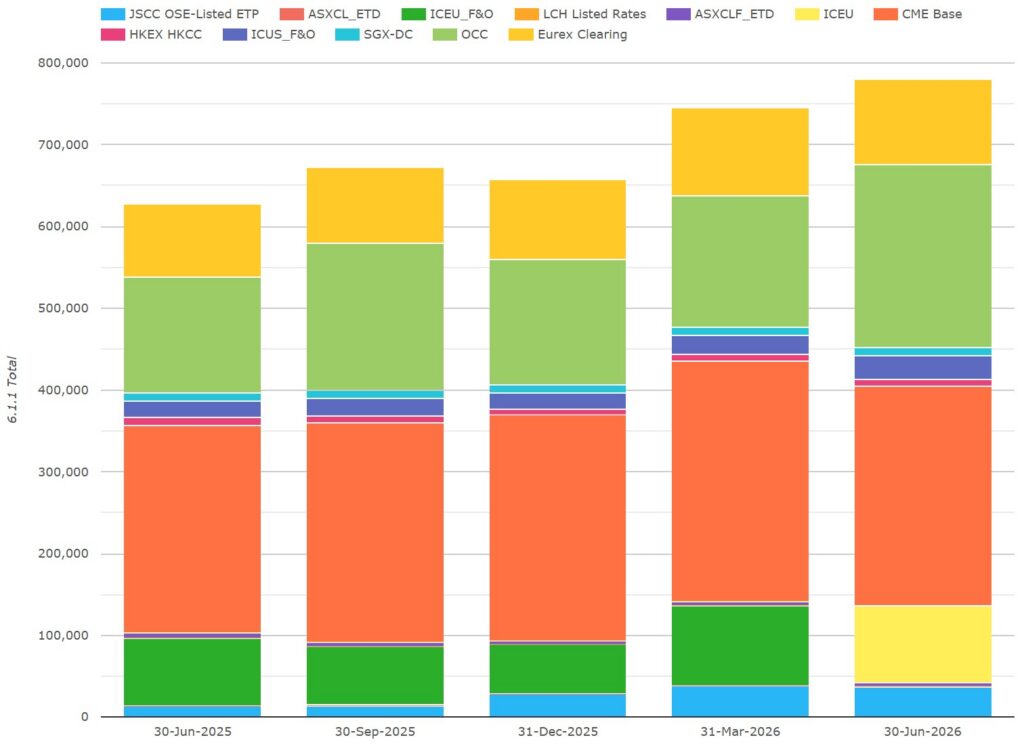
Chart 5: ETD IM by CCP ($ millions). Source: CCPView
Note: Chart 5 figures include Eurex OTC IRS IM, which I excluded from the following figures.
IM at our ten selected ETD CCPs was a record $732 billion on 30 June 2026 – up 26% YoY and up 5.0% from the Q1 2026 high of $697 billion.
- CME disclosed $269 billion – up 5.8% YoY but down 8.4% from the Q1 2026 high of $294 billion.
- OCC had $223 billion – up 57% YoY and up 24% from the Q3 2025 high of $180 billion.
- ICE Europe (ICEU, renamed from ICEU_F&O) declared $94.5 billion – up 13% YoY but down 3.4% from the Q1 2026 high of $97.9 billion.
- Eurex divulged $56.5 billion – up 28% YoY but down 4.2% from the Q1 2026 high of $59.0 billion.
- JSCC OSE Listed ETP reported $37.2 billion – up all of 194% YoY but down 1.9% from the Q1 2026 high of $37.9 billion.
- ICE US F&O showed $27.7 billion – up 36% YoY and up 20% from the Q1 2026 high of $23.0 billion.
- SGX-DC had $11.0 billion – up 19% YoY and up 1.6% from the Q1 2026 high of $10.9 billion.
- HKEX HKCC declared $7.51 billion – down 20% YoY from the Q2 2025 high of $9.35 billion.
- ASX CLF ETD and ASX CL ETD combined divulged $4.61 billion – down 25% YoY from the Q2 2025 high of $6.17 billion.
- LCH Listed Rates reported IM of $49 million – up 8.2x YoY but down 30% from the Q1 2026 high of $70 million.
- The record was powered by 20+% IM growth at OCC and ICE US while IM declined at most rates ETD CCPs.
For comparison, we look at the corresponding quarterly rates ETD OI statistics.
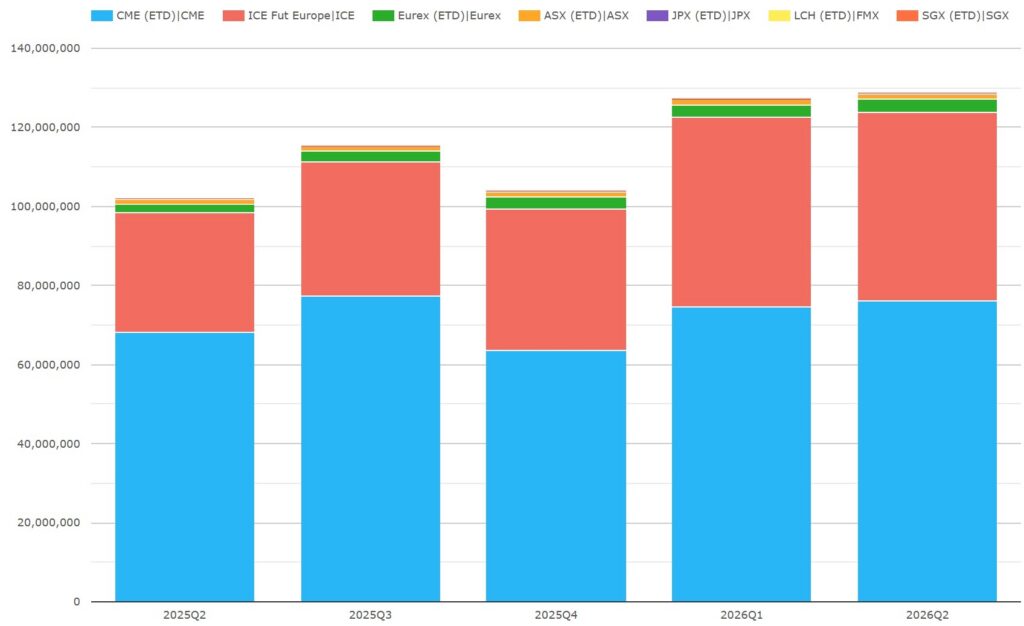
Chart 6: rates ETD OI by CCP ($ millions). Source: CCPView
Chart 6 shows the Q2 2026 OI dynamic at seven of the CCPs in Chart 5 was aligned with the Q2 2026 dynamic in their IM.
It is noteworthy (though invisible in the chart) that LCH / FMX OI was up 2.4% QoQ while, from Chart 5, IM declined by 30% QoQ. Participants have found margin efficiency either by trading with margin more carefully in mind or perhaps by expanding use of LCH portfolio margining against swaps.
Other disclosures – OTC client clearing concentration
Here is a summary for selected CCPs which report client clearing concentration disclosures (19.1) for OTC derivatives specifically, as opposed to for an entire CCP group (the reason Eurex is excluded).
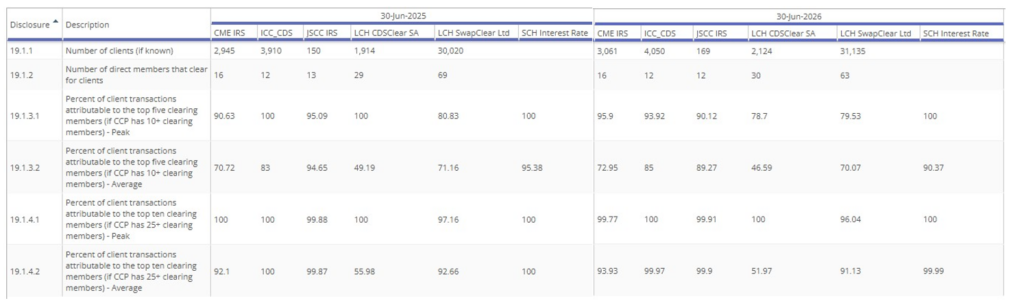
Table 1: client clearing concentration disclosures for Q2 2025 and Q2 2026. Source: CCPView
Since concentration numbers usually change slowly, I included Q2 2025 for comparison rather than Q1 2026. The following points occur to me:
- The CCPs combined have over 40,500 client relationships – up 1,600 YoY of which over 1,100 were added by LCH SwapClear. This number is easier to understand when you consider that quite a few of the largest asset managers have over 500 funds, each of which is treated as a separate account by a CCP.
- CCP client-clearing memberships were 133 – down 6 YoY, mainly at LCH SwapClear.
- The top 5 members average share of client volume was 70% at LCH SwapClear (down 1.1 points YoY), 85% at ICE Clear Credit (up 2 points YoY), 73% at CME IRS (up 2.2 points YoY), and 89% at JSCC IRS (down 5.4 points YoY).
- The top 10 members average share of client volume was 91% at LCH SwapClear (down 4.0 points YoY), 100% at ICE Clear Credit (flat YoY), 94% at CME IRS (up 1.8 points YoY), and 100% at JSCC IRS (flat YoY). The 100% statistics for ICE and JSCC are more easily understood when realizing that each CCP has a total of 12 client-clearing members.
- Client-clearing concentration risk depends on the split among clearing members of open client portfolios. Changes in this split will be aligned to total client volumes by clearing member, for which the average clearing-member shares of client transaction volume are a reasonable proxy. Therefore, I do not highlight here the peak-based shares.
From the recent blog, seven bank FCMs have 93% of swap US customer seg and I imagine similar percentage is shared by a similarly small group of clearing brokers. (Unfortunately, there is no direct equivalent in Europe and Asia of CFTC’s monthly Financial Data for FCMs). Even without scientific comparison, the above concentration figures seem consistent the FCM customer seg shares in the other blog.
Next quarter, I will pick up a different disclosure to cover in this section. If you have access to CCPView, feel free to explore that or other disclosures in the meantime.
End note
Flip back to the start of the blog to recap the takeaways.
CCPView disclosures tab has quarterly disclosures data from 30 September 2015 to 30 June 2026 for 44 clearinghouses, each with multiple clearing services, covering equities, bonds, futures, options, and OTC derivatives – with over 200 quantitative data fields with supporting notes.
If you are interested in using CCPView, get in touch.