
This blog looks at Q2 2026 volumes of FX derivatives (FXD), following the record volumes noted in Q1.
Key takeaways
In Q2 2026:
- NDFs volumes exceeded their Q1 2026 cleared record by 3.5% and their Q1 2026 US-reported record by 2.0%.
- Roughly one third of global NDFs were cleared.
- Cleared FX options barely beat their Q1 2026 record by 0.6% while US-reported FX options were down 14% from their Q1 2026 record.
- About one eighth of global FX options were cleared.
- New cleared record volumes were also set by FX forwards with US$179 billion, and spot FX with US$7.11 billion.
Read on for more analysis, explanation and volume charts and statistics from CCPView and SDRView.
Note on volume statistics
Cleared FX OTC derivatives covered by CCPView include NDFs, FX options, FX forwards, NDOs, and spot FX and are globally complete.
FX OTC derivatives covered by SDRView include the mandated option, non-deliverable, and exotic products while the optionally-reported spot and deliverable forward trades are not fully reported. Volumes are dominated by vanilla options and NDFs. SDR-reporting covers both cleared and uncleared trades where a US party is on one or both sides. SDRView thus omits about half the global total while still providing a good guide to global volume dynamics over time.
Because trades reported to SDRs as “uncleared” may sometimes be cleared post-trade, we “guesstimate” FXD product clearing rates by dividing the CCPView cleared totals by double the SDR-reported volumes.
Cleared FXD volumes
We look at cleared FXD by product type: NDFs, FX options, FX forwards, NDOs, and spot.
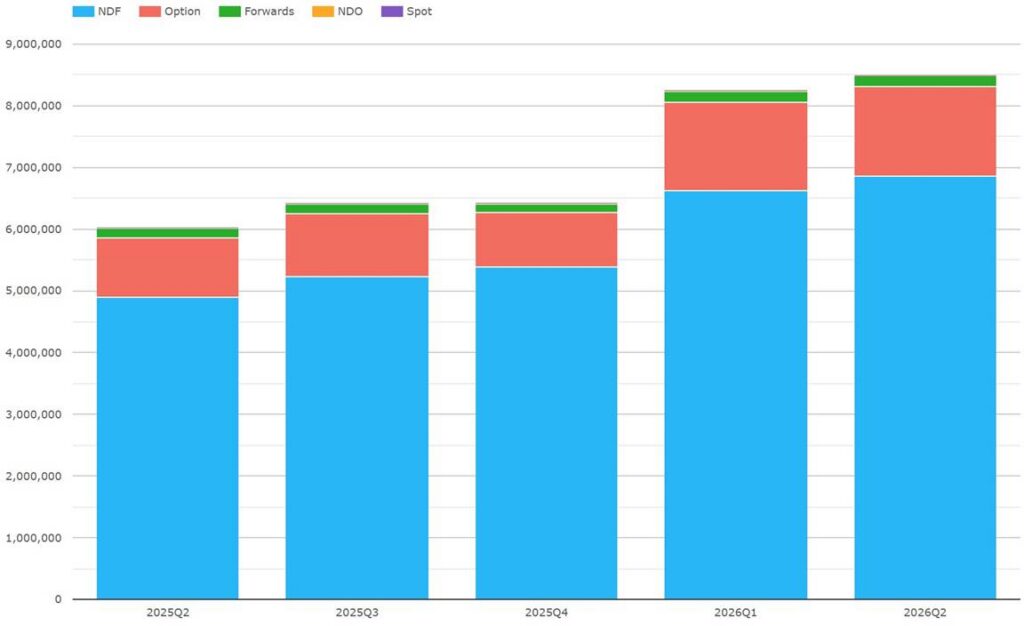
Chart 1: Cleared FXD by product (notional US$ millions). Source: CCPView
Chart 1 shows that Q2 2026 FXD volumes were US$8.50 trillion, a new record – up 41% YoY and up 3% from their Q1 2026 record of US$8.25 trillion.
- NDFs were by far the largest with US$6.86 trillion – up 40% YoY and up 3.5% from their Q1 2026 record of US$6.63 trillion.
- FX options were next largest with US$1.445 trillion – up 53% YoY and up 0.60% from their Q1 2026 record of US$1.437 trillion.
- FX forwards were US$179 billion – up 6.5% YoY and up 2.0% from their Q1 2026 record of US$175 billion.
- Spot FX was US$7.11 billion – up 160% YoY and up 23% from their Q1 2026 record of US$5.79 billion.
- NDOs were US$3.44 billion – down 50% YoY and down 55% from their Q1 2026 record of US$7.59 billion.
The strong cleared spot FX growth perhaps indicates that more banks need to actively manage CLS settlement limits due to increased volumes of cleared FX forwards or cleared FX option exercises.
The rest of this blog digs further into the volumes of NDFs and FX options.
NDFs
We start with a currency breakdown of cleared NDFS.
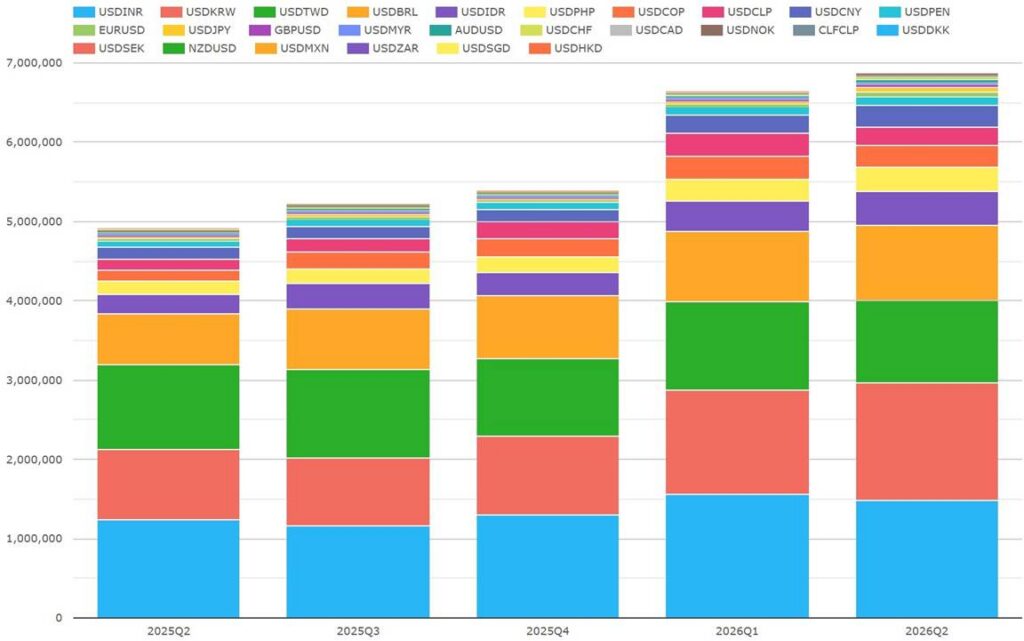
Chart 2: Cleared NDFs (notional US$ millions). Source: CCPView
Chart 2 breaks down by currency the Q2 2026 NDF volumes in Chart 1. The twelve non-deliverable currency pairs made up 96.2% of Q2 volumes with US$6.60 trillion – up 38% YoY and up 2.0% QoQ. We highlight the top five plus CNY.
- KRW overtook INR to be largest at US$1.49 trillion – up 69% YoY and up 13% from its Q1 2026 record of US$1.32 trillion.
- INR was next with US$1.48 trillion – up 20% YoY but down 5.1% from its Q1 2026 record of US$1.56 trillion.
- TWD saw US$1.03 trillion – down 3.3% YoY and down 7.1% from its Q1 2026 record of US$1.11 trillion.
- BRL had US$946 billion – up 47% YoY and up 7.0% from its Q1 2026 record of US$884 billion.
- IDR cleared US$429 billion – up 71% YoY and up 15% from its Q1 2026 record of US$373 billion.
- CNY was US$271 billion – up 82% YoY and up 19% from its Q1 2026 record of US$227 billion. CNY was eighth in volume.
Deliverable currencies made up the remaining 3.8% of the volumes with US$261 billion – up 136% YoY and up 66% QoQ.
Looking at CCP market share, a chart would not help show that LCH ForexClear slightly increased its dominant cleared NDFs share at the expense of both ComDer and CME with 99.4% in Q2 2026 – up YoY from 99.0% and up QoQ from 99.1%.
Now, we look at US-reported NDFs – limiting to the top 30 pairs which consistently make up 99.3% of volumes.
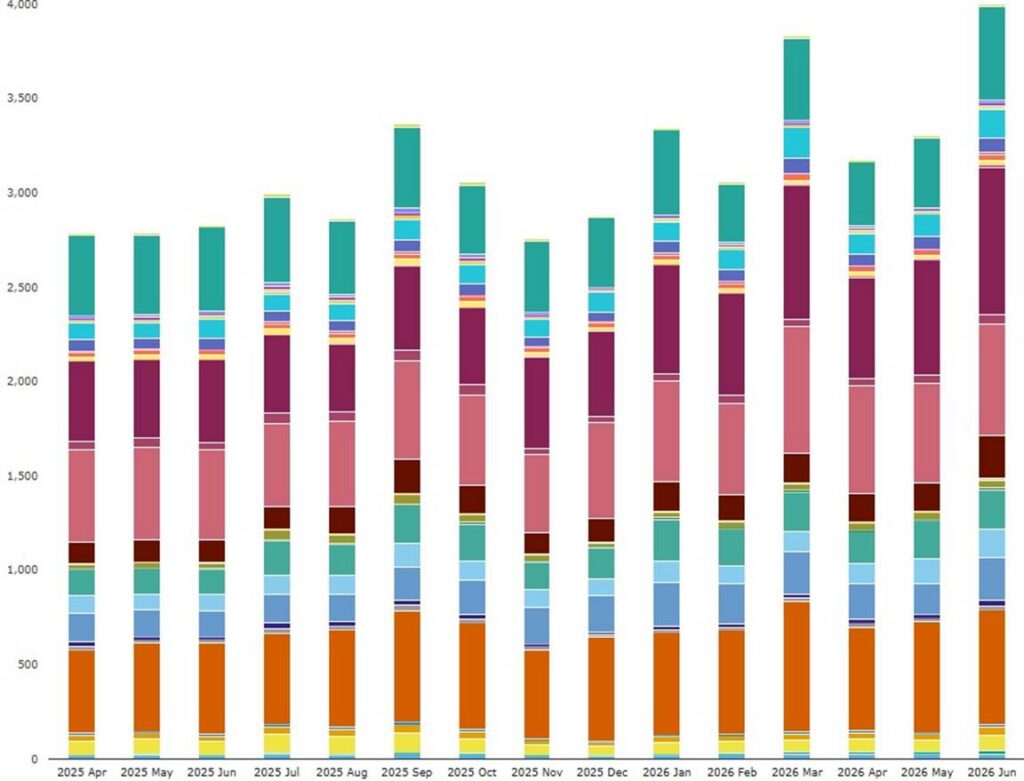
Chart 3: US-reported NDF volumes in the top 30 currency pairs (notional US$ billions). Source: SDRView
Chart 3 illustrates the higher Q2 2026 volumes in the top 30 pairs of a record US$10.5 trillion – up 25% YoY and up 2.4% from their Q1 2026 record of US$10.2 trillion.
NDFs on the top 14 non-deliverable pairs were US$9.40 trillion of the total – up 26% YoY and up 1.0% from their Q1 2026 record of US$9.29 trillion. We highlight the top four currencies plus CNY.
- KRW (in claret) had the largest volume with US$1.93 trillion – up 51% YoY.
- BRL (in orange) was second with US$1.75 trillion – up 25% YoY but down 2.1% QoQ.
- INR (in pink) was next at US$1.68 trillion – up 15% YoY but down 0.4% QoQ.
- TWD (in dark turquoise) saw US$1.21 trillion – down 6.4% YoY but up 1.1% QoQ.
- CNY (in pale blue) had US$384 billion – up 40% YoY and up 20% QoQ. CNY was eighth in volume.
The top 16 deliverable pairs made up our top 30 and had US$1.09 trillion – up a more muted 13% YoY but 20% off their Q3 2025 record of US$1.36 trillion.
Estimating the Q2 2026 cleared fraction for NDFs, we have 6.86 / (10.5 x 2) = 32.6%, about one third.
FX options
Moving onto FX options, cleared volumes break down as follows.
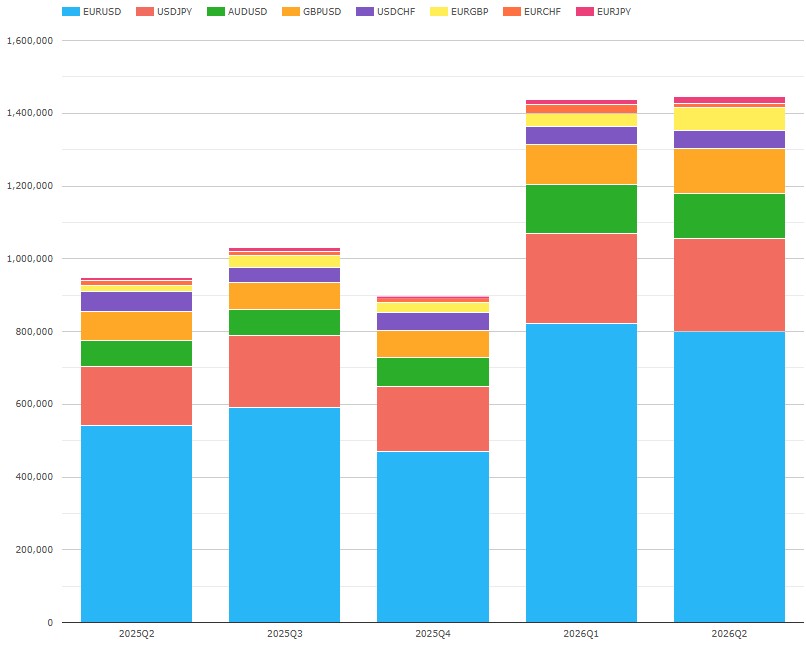
Chart 4: Cleared FX options (notional US$ millions). Source: CCPView
Chart 4 breaks down by currency pair the Q2 2026 FX options volumes in Chart 1. Trades versus USD were 93.5% of the volumes and broke down as follows:
- EUR was by far the largest at US$800 billion – up 48% YoY but down 2.7% from its Q1 2026 record of US$823 billion.
- JPY was next at US$256 billion – up 58% YoY and up 3.9% from its Q1 2026 record of US$246 billion.
- GBP took back third place from AUD with US$124 billion – up 54% YoY and up 11% from its Q1 2026 record of US$111 billion.
- AUD was next with US$122 billion – up 68% YoY but down 9.0% from its Q1 2026 record of US$134 billion.
- CHF had US49.7 billion – down 5.9% YoY from its Q2 2025 record of US$52.8 billion.
The remaining US$93.3 billion was made up of EUR crosses versus GBP, JPY, or CHF.
The marginal new cleared FX options record only happened with the help of a US$26.4 billion or 73% QoQ increase in FX options traded in EUR versus GBP – comfortably the largest dollar increase of any pair versus USD or EUR.
All FX options were cleared at LCH ForexClear.
Now, we look at US-reported vanilla FX options – limiting currency pairs to the top 10 traded versus USD and the top five crosses versus EUR which combined made up about 90% of the Q2 2026 volumes. (More than 100 other pairs made up the remaining volume.)
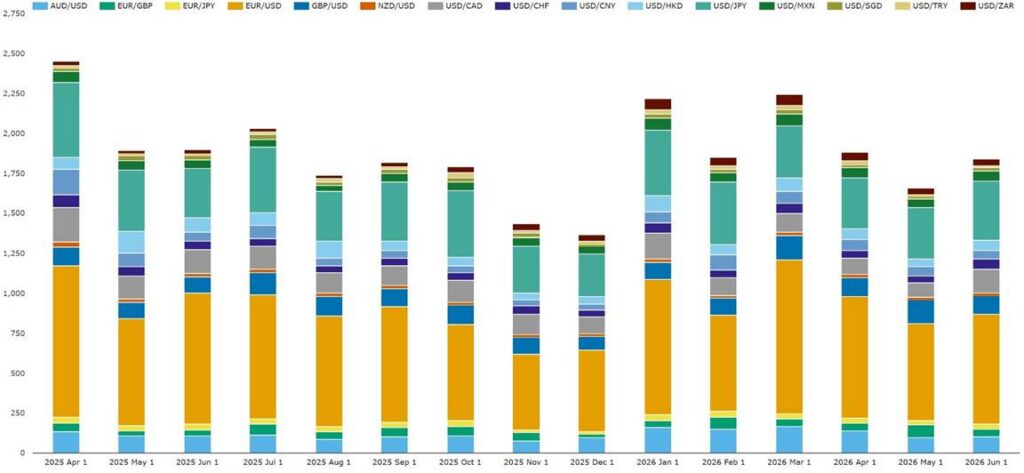
Chart 5: US-reported FX options in 15 selected pairs (notional US$ billions). Source: SDRView
Chart 5 illustrates that Q2 2026 US-reported FX options volumes in those 15 pairs were US$5.47 trillion (of an all-pairs total of US$6.11 trillion) – down 18% YoY and down 13% from their Q1 2026 record of US$6.28 trillion.
The top 10 pairs traded versus USD made up US$4.95 trillion – down 15% YoY and down 15% from their Q1 2026 record of US$5.83 trillion. We highlight the major currencies plus CNY.
- EUR was the largest at US$2.06 trillion – down 16% YoY.
- JPY was next at US$1.01 trillion – down 13% YoY.
- GBP overtook AUD with US$376 billion – up 19% YoY.
- CAD also overtook AUD with US$338 billion – down 33% YoY.
- AUD was next at US$337 billion – down 2.1% YoY.
- CNY was next at US$179 billion – down 41% YoY. CNY was seventh in volume.
The top five crosses against EUR had volume of US$517 billion – up 51% YoY and up 13% from their Q1 2026 record of US$457 billion. The leading pairs by volume were EUR versus GBP, HUF, and JPY.
In summary, Q2 2026 US-reporting of FX options saw material volume increases in crosses versus EUR at the same time as material volume declines in pairs versus USD.
Estimating the Q2 2026 cleared fraction for FX options, we have 1.45 / (6.11 x 2) = 11.9%, about one eighth.
That’s it
We used five charts to cover OTC FXD volumes.
You can find a lot more data in CCPView and SDRView.
Contact us if you’re interested in a subscription.