
This is the Q2 2026 edition of our quarterly blog on competition between rates derivatives exchanges and CCPs. It can be directly compared with the Q1 edition and is a complement to our recent Q2 blog on cleared rates swaps volumes.
Key takeaways
In Q2 2026, the quarter on quarter (QoQ) shifts in the CCP shares of competitive cleared derivatives products were as follows.
- EUR swaps: Eurex’s share declined 0.8 points to 12.4% to LCH’s 87.6%. The marginal change hints that further shifts in Eurex’s share driven by the Active Account Requirement (AAR) may be limited.
- JPY swaps: JSCC’s share rose by 7.7 points to 48.2% to LCH’s 51.8%, a strong comeback after the 2025 upward trend in LCH shares driven by a surge in buy-side interest in JPY swap trading.
- CNY swaps: Shanghai Clearing House (SCH) share rose by 6.2 points to a record 79.2% to LCH’s 20.8%, a combined result of absolute volume growth in direct SCH onshore clearing and absolute volume decline in LCH offshore clearing.
- INR swaps: CCIL share grew by 3.7 points to 31.2% to LCH’s 68.8%.
- USD SOFR futures: FMX/LCH’s share rose by 0.18 points to 0.78% to CME’s 99.22%, a result of FMX/LCH’s flat absolute volumes while CME volumes declined.
- EUR Euribor futures and €STR futures: ICE remained above 90% for the second quarter running despite a decline of 1.8 points to 92.5%.
- JPY TONA futures: JPX’s share of much reduced absolute volumes increased by 11.1 points to 51.7% compared with TFX’s 29.0% and SGX’s 19.3%.
Read on for more analysis.
Introduction
We cover each of our established competitive currencies for cleared swaps and MM futures, then check newly competitive currencies.
EUR swaps: LCH versus Eurex
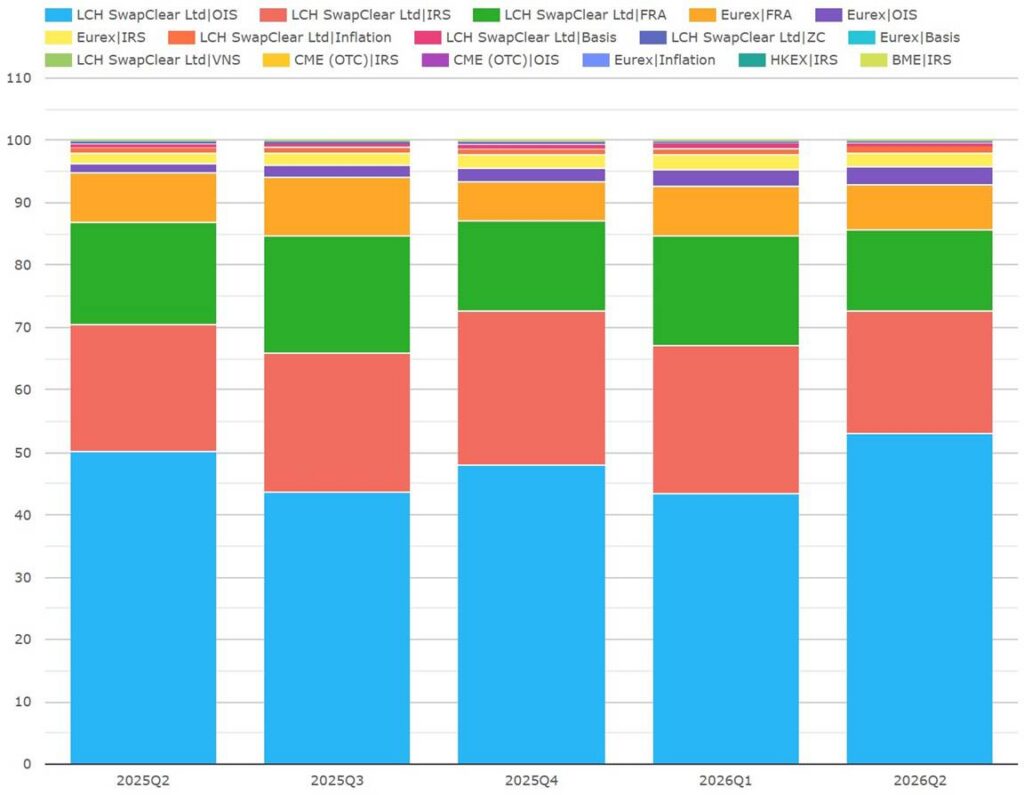
Chart 1: volumes of cleared EUR swaps by CCP and product type (percent of EUR notional). Source: CCPView
Chart 1 illustrates shares of Q2 2026 EUR swaps with Eurex at 12.4%, LCH at 87.6%, and CME at 0.0017%.
- Eurex’s share was down 0.82 points QoQ.
- Eurex’s share FRA 7.1%, OIS 3.0%, and IRS 2.2%.
- LCH’s share was made up of OIS 53.1%, IRS 19.4% and FRA 13.2%.
- The chart also shows that both LCH and Eurex shifted their product mix towards OIS and away from IRS and FRA.
- We could have excluded FRAs (which are reset management activity) in order to focus the analysis on true risk trades’ clearing. This would lead to shares of Eurex 6.7%, LCH 93.3%, and CME 0.0021%.
The marginal QoQ change in share hints that 12-13% of all cleared EUR swaps (or 6-7% of EUR swaps risk trading) may be the new normal for Eurex. By comparison Eurex averaged 8.8% of all cleared EUR swaps for all of 2024, before the Active Account Requirement (AAR) transition in 2025.
JPY swaps: LCH versus JSCC
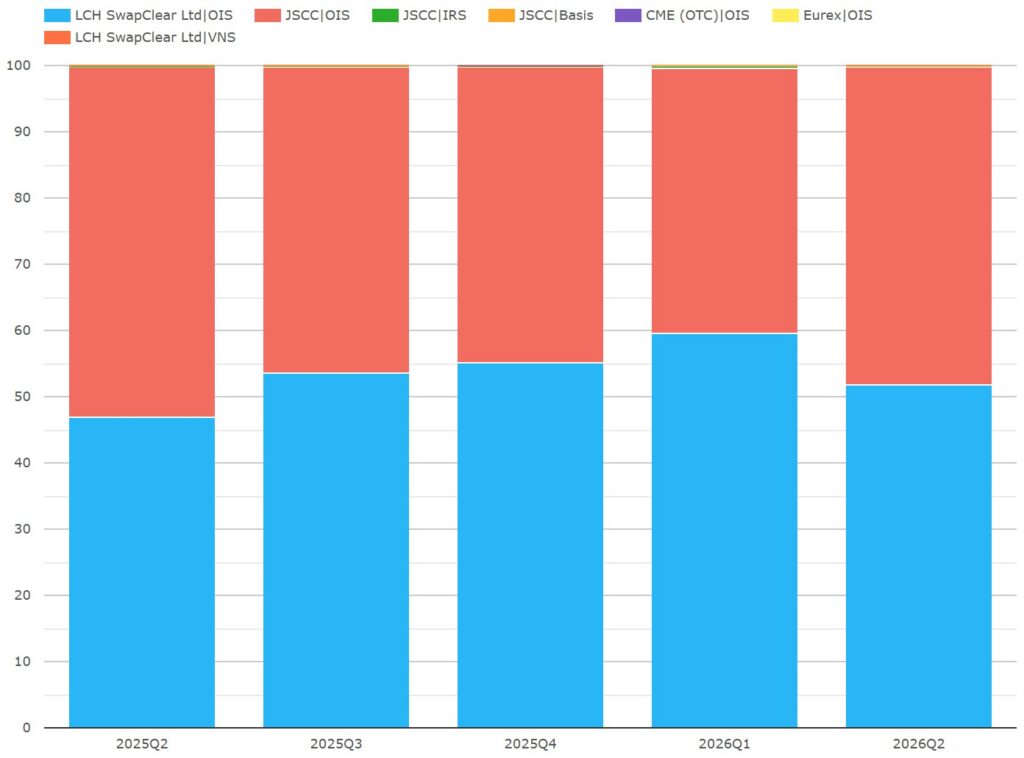
Chart 2: volumes of cleared JPY swaps by CCP and product type (percent of EUR notional). Source: CCPView
Chart 2 shows that OIS dominated Q2 2026 JPY swaps volumes and that there was a QoQ market share swing of 7.7% from LCH to JSCC.
- LCH’s share was 51.8% – down 7.7 points QoQ.
- JSCC’s share was 48.2% – up 7.7 points QoQ.
- CME had 0.00022% – down from 0.01661% QoQ.
- Eurex did not clear JPY swaps in Q2 after momentarily clearing trades in Q1.
JSCC had its first quarterly share increase after LCH’s surge in the prior four quarters. Per the prior blogs linked above, JSCC only recently started clearing US buy-side firms after the CFTC granted them permission to clear at JSCC last September.
CNY swaps: Shanghai Clearing versus LCH
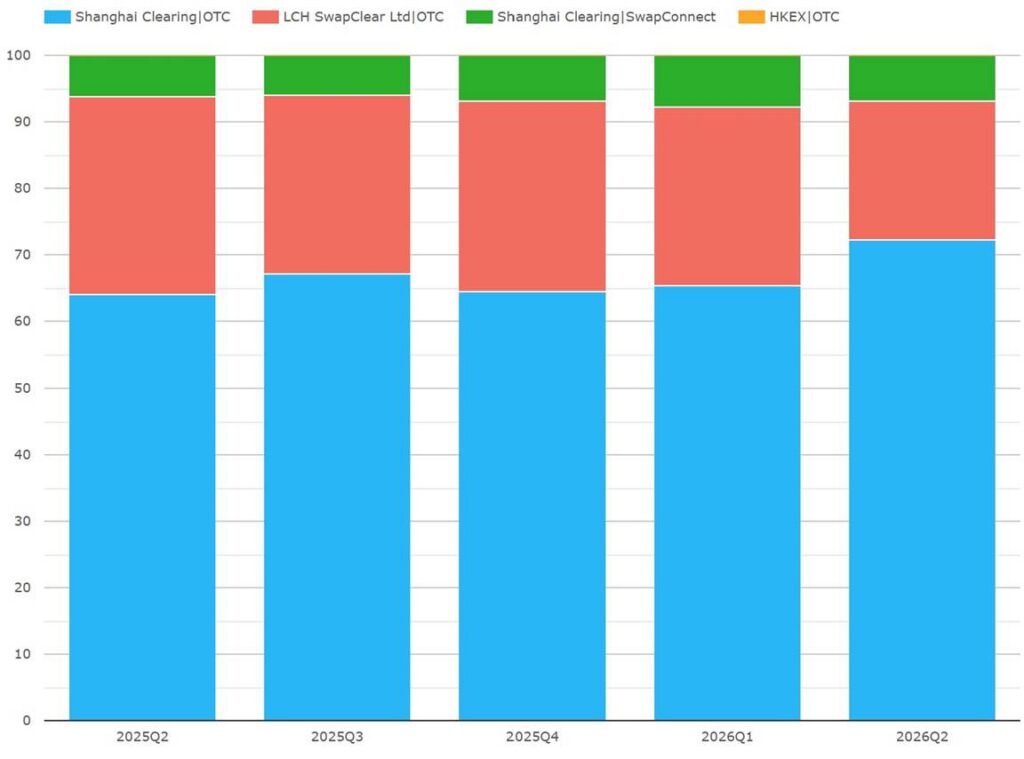
Chart 3: volumes of cleared CNY swaps by CCP and exchange (percent of CNY notional). Source: CCPView
Chart 3 shows that, in Q2 2026, there was a QoQ swing of 6.2% from LCH to Shanghai Clearinghouse (SCH) which set a record of 79.2% – up nearly 6 points from the Q3 2025 prior record of 73.3%.
- SCH direct onshore clearing had 72.3% – up 7.0 points QoQ.
- SCH onshore clearing via SwapConnect had 6.9% – down 0.8 points QoQ.
- LCH SwapClear’s offshore clearing of non-deliverable IRS saw 20.8% – down 6.2 points QoQ.
- HKEx’s share was 0.014% – down 0.016 points QoQ.
- In absolute terms, it is notable that (not shown) SCH direct onshore clearing volumes rose while LCH offshore clearing declined.
INR swaps: LCH versus CCIL
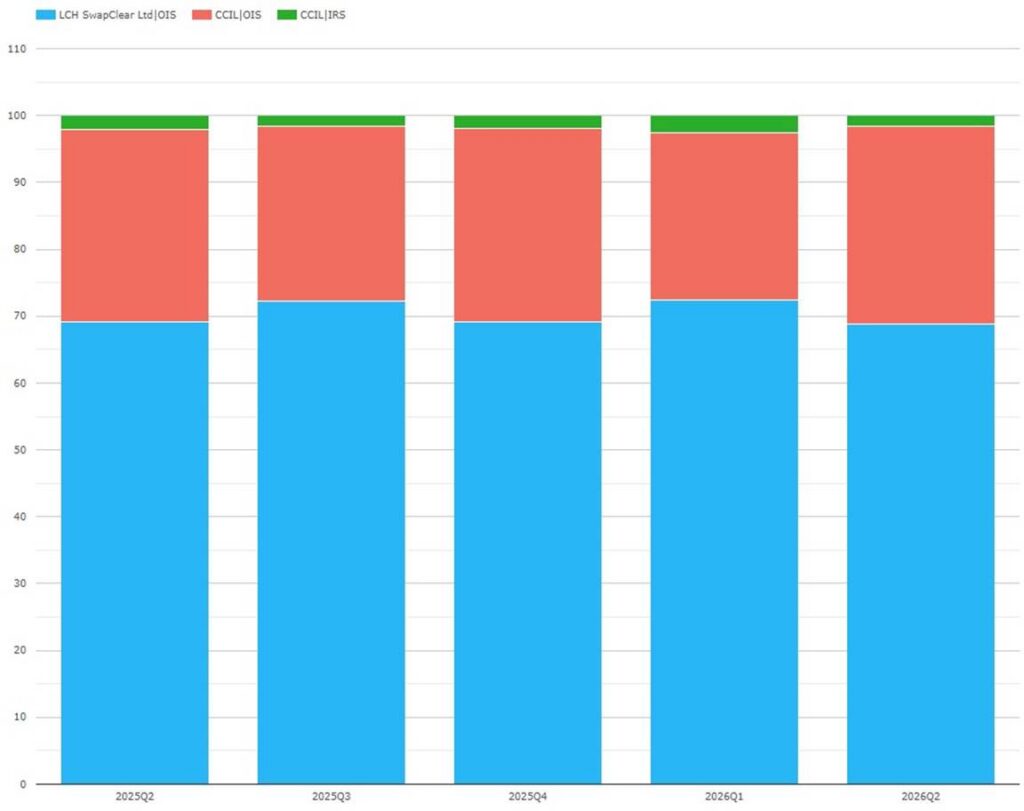
Chart 4: volumes of cleared INR swaps by CCP and product type (percent of INR notional). Source: CCPView
Chart 4 shows that CCIL’s share of Q2 2026 INR swaps was 31.2% (to LCH’s 68.8%) – up 0.4 points YoY and up 3.7 points QoQ.
It is notable that shares remained flat YoY, while absolute volumes grew YoY by more than 58% (not shown).
Looking further back than Chart 4, CCIL’s share from onshore INR deliverable swaps clearing has been close to 30% since Q2 2020, after LCH launched offshore clearing of INR non-deliverable swaps in early 2018.
USD SOFR futures: CME versus FXM/LCH
We focus here only on SOFR futures, as other USD MM futures products are currently only offered by CME – the most material in volume terms being FedFunds futures, which are about 40% of the notional volumes of SOFR futures.
CME remains dominant with over 99% of notional volumes, but FMX/LCH’s volumes recently showed exponential growth that is better understood via numerical grids than charts.
SOFR futures by exchange/CCP. Source: CCPView
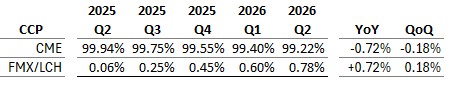
Table 1: market share (percentage of notional)
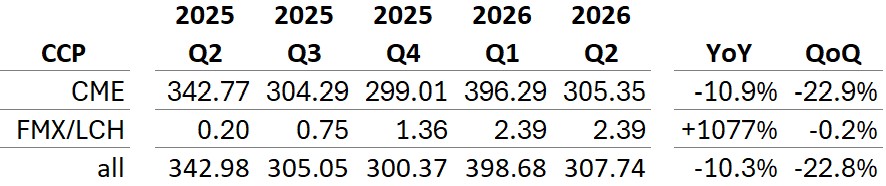
Table 2: Volumes (notional USD trillions)
Table 1 shows that FMX/LCH’s Q2 market share was 0.78% – up 0.18 points QoQ. Table 2 shows that FMX/LCH’s Q2 2026 volumes were $2.39 trillion – flat QoQ while CME SOFR volumes declined QoQ by 23%.
FMX/LCH maintained volumes while CME’s declined: share increased while volumes did not. Another quarter of statistics may clarify the growth trajectory.
EUR Euribor and EONIA futures: LCH versus Eurex
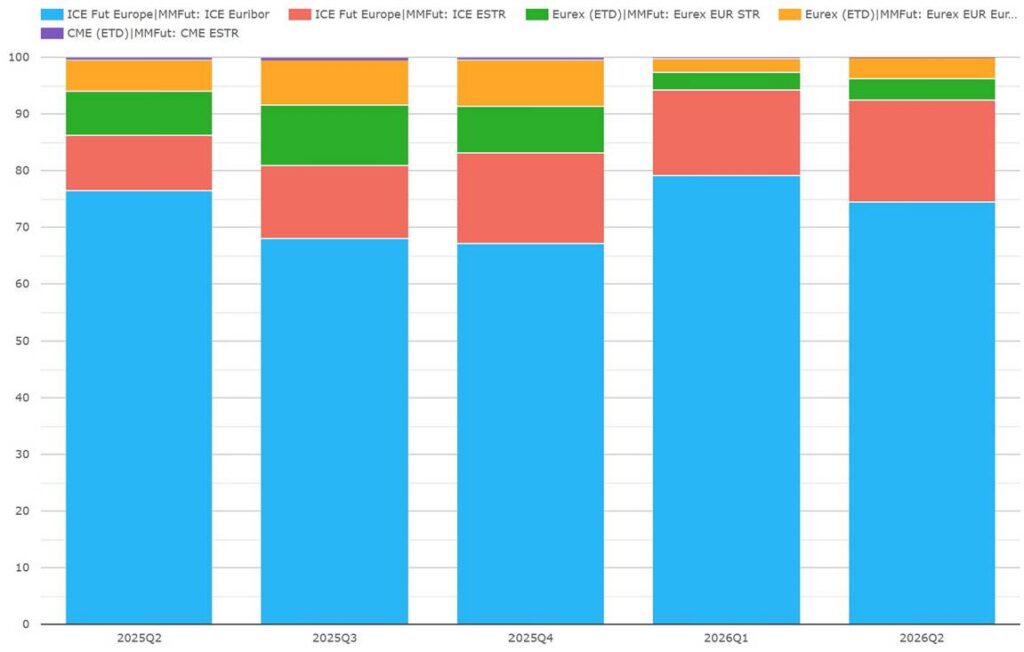
Chart 5: volumes of EUR MM futures by exchange/CCP and index (percent of EUR notional). Source: CCPView
Chart 5 shows that ICE’s share of Q2 2026 EUR MM futures across both indexes was 92.5% to Eurex’s 7.5%.
- ICE’s share was 92.5% – down 1.8 points QoQ.
- Eurex’s share was 7.5% – up 1.9 points QoQ.
- CME’s share was 0.073% – down 0.072 points QoQ.
From Chart 5’s figures we can compute shares of each index’s futures.
- Euribor futures: ICE had 95.3% (down 1.6 points QoQ) to Eurex’s 4.7%.
- EONIA futures: ICE had 82.3% (down 0.33 points QoQ) to Eurex’s 17.4% and CME’s 0.33%.
Despite marginal share losses in each index ICE remained above 90% for the second quarter running.
JPY MM futures (TONA): JPX versus TFX versus SGX
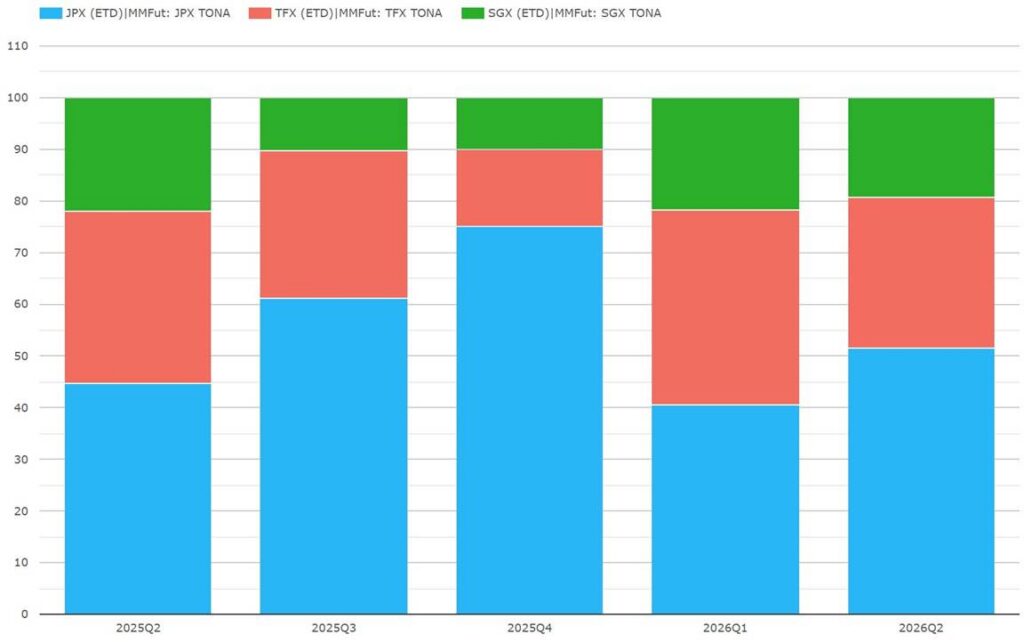
Chart 6: volumes of JPY TONA MM futures by exchange/CCP (percent of JPY notional). Source: CCPView
Chart 6 shows dynamic quarter-by-quarter market share shifts which need to be summarized exchange-by-exchange.
- JPX had 51.7% – up 11.1 points QoQ.
- TFX had 29.0% – down 8.6 points QoQ.
- SGX had 19.3% – down 2.5 points QoQ.
JPX increased share in Q2 after having suffered the brunt of the marked decrease in absolute trading volume in Q1 (not shown). SGX’s share seems to be settling near 20%.
Q2 2026 competition overview
Lastly, I included market share overview charts below to see whether other currencies have become more competitive in Q2 2026 than before and show the dominant CCP in each of the non-competitive currencies.
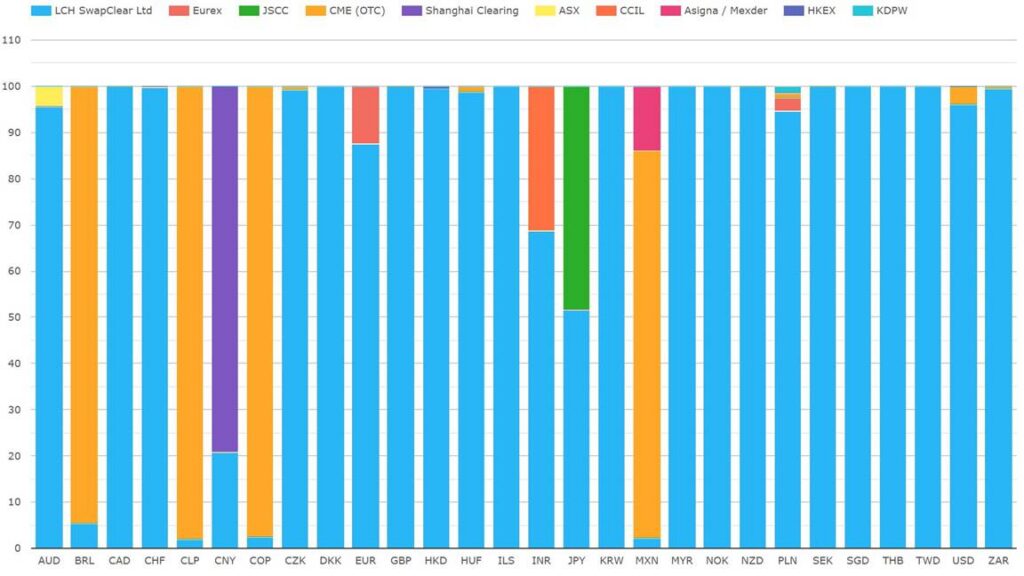
Chart 7: CCP market shares of Q2 2026 swap volumes by currency (percent of USD notional). Source: CCPView
As well as confirming the competitive swap currencies covered above, Chart 7 highlights an emerging challenge to CME dominance in MXN swaps from Asigna / Mexder whose share jumped to 14.1% after previously being 3% or below. Shares away from LCH in PLN also exceeded 5% for the first time with Eurex taking 3.1%, KDPW 1.6%, and CME 0.8%.
We will expand add sections on MXN and PLN to the Q3 edition of this blog.
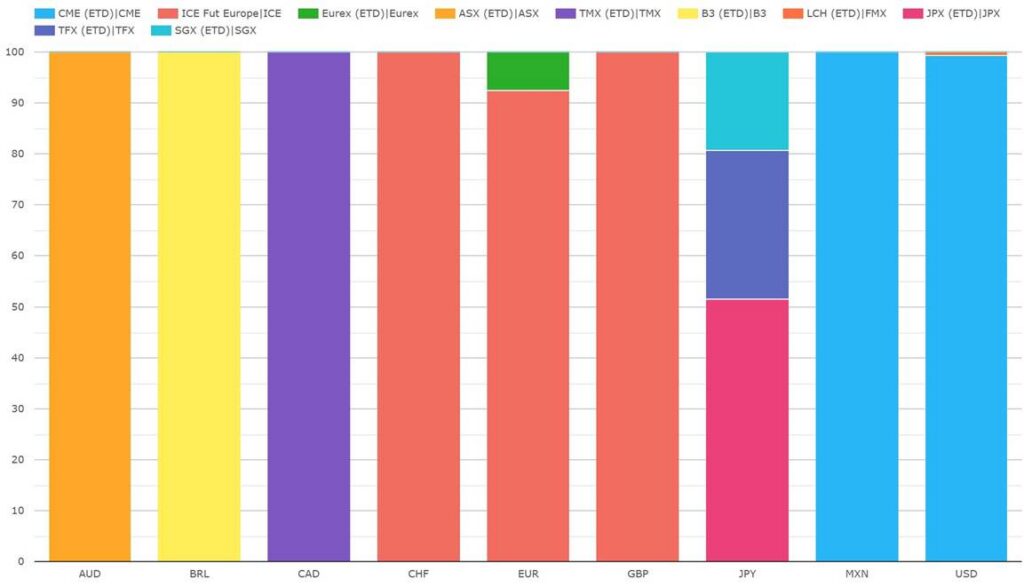
Chart 8: CCP/exchange market shares of Q2 2026 MM futures volumes by currency (percent of USD notional). Source: CCPView
Chart 8 confirms the three competitive MM futures currencies covered above with no newly competitive currencies.
In case of doubt, similar charts to those above confirm 100% dominance by a single CCP for each currency of each of the other ETD product types (bond futures, swapfutures, options on MM futures, and options on bond futures). I therefore omit those charts for brevity.
That’s it
With eight charts and two tables we created a mixed picture of increases or decreases in the share of the more dominant CCP in each case.
This analysis used but a small subset of the broad array of cleared instruments, metrics, and analysis parameters covered by CCPView. Click the link for more details, or contact us for a demonstration.
Flip back to the top to recap the takeaways.
Stay informed with our FREE newsletter: subscribe here.