
This blog covers global notional volumes of cleared rates swaps in quarter two (Q2) 2026, focusing on volumes of OIS, fixed-float IRS and zero-coupon swaps with a material volumes’ share for each currency.
Key takeaways
In Q2 2026 global core cleared rates swaps volumes were US$262 trillion notional – up 23% YoY but down 17% from their Q1 2026 record. Despite the sharp QoQ volume declines, YoY increases indicate an upward longer-term volume trajectory for most currencies.
- USD Fed Funds OIS and SOFR OIS combined volumes were US$73.4 trillion – up 17% YoY but 15% off their Q3 2025 record.
- EUR Euribor IRS and €STR OIS combined cleared a record of €76.3 trillion – up 31% YoY and 8.6% above their Q1 2025 record.
- GBP SONIA OIS saw £22.0 trillion – down 11% YoY and 58% off their Q1 2026 record.
- JPY TONA OIS had ¥4,495 trillion – up 91% YoY but 4.3% off their Q4 2025 record.
- AUD BBSW IRS and AONIA OIS combined cleared A$19.1 trillion – up 4.0% YoY but 43% off their Q1 2026 record.
- CAD OIS (CORRA) totaled C$8.1 trillion – up 11% YoY but 29% off their Q1 2026 record.
- Non-major currency IRS, OIS and ZCS totaled US$25.8 trillion – up 39% YoY but 8.6% off their Q1 2026 record.
Read on for supporting analysis, charts, and statistics.
Note that I have not changed the scope but made this edition punchier by limiting to one chart per major currency, limiting to one chart for all non-major currencies and deferring discussion of CCP market shares to the regular blog on that topic coming shortly.
USD Fed Funds and SOFR OIS
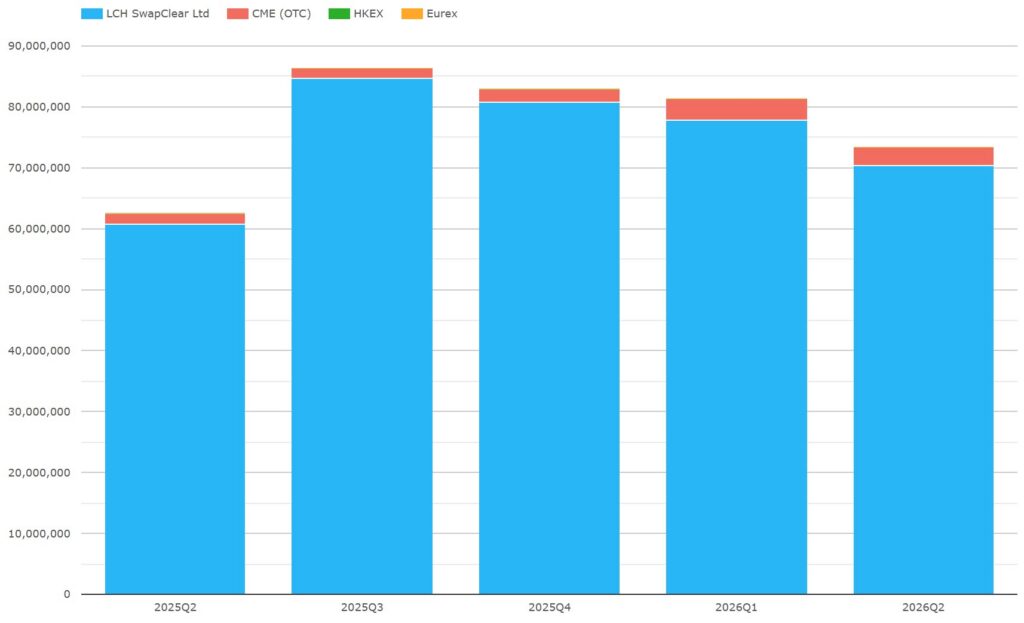
Chart 1: USD OIS volumes (single-sided gross notional US$ millions). Source: CCPView
Chart 1 shows that Q2 2026 USD Fed Funds OIS and SOFR OIS combined volumes retreated to US$73.4 trillion – still up 17% YoY but down 15% from the Q3 2025 record of US$86.4 trillion.
- LCH SwapClear had US$70.3 trillion – up 16% YoY but down 17% from its Q3 2025 peak of US$84.7 trillion.
- CME OTC had US$3.08 trillion – up 62% YoY but down 11% QoQ from its Q1 2025 record of US$3.46 trillion.
EUR Euribor IRS and €STR OIS
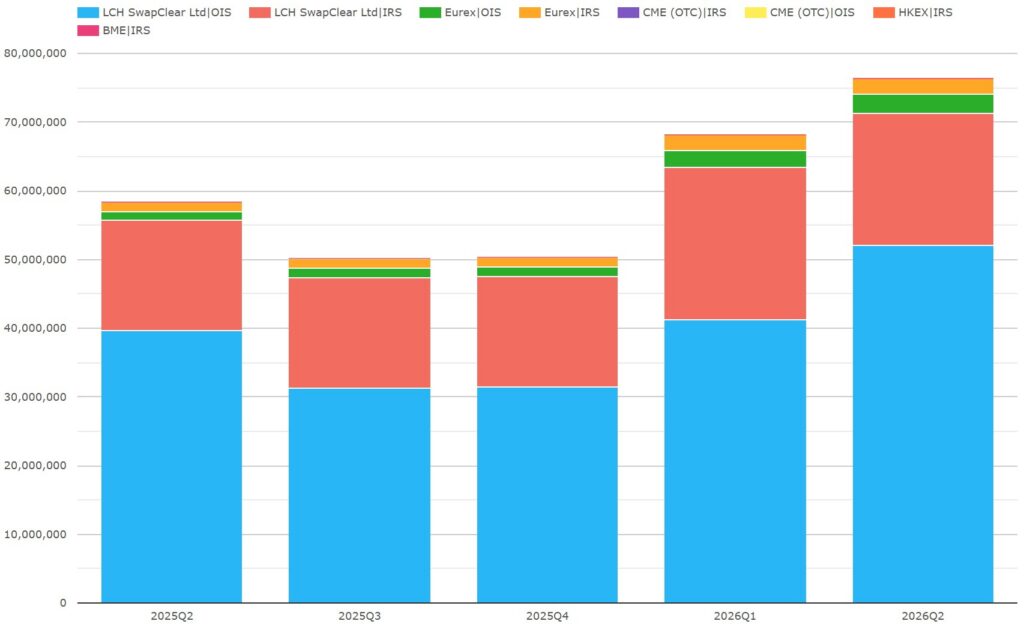
Chart 2: EUR Euribor IRS and EONIA OIS volumes (single-sided gross notional EUR millions). Source: CCPView
Chart 2 shows that, in Q2 2026, EUR Euribor IRS and EONIA OIS totaled €76.3 trillion, their highest ever quarter – up 31% YoY and up 8.6% from the Q1 2025 record of €70.3 trillion. At an FX rate of 1.14, the total is equivalent to US$87.0 trillion.
- LCH SwapClear had a record €71.2 trillion – up 28% YoY and up 12% from the Q1 2025 record of €63.5 trillion.
- Eurex had a record €5.15 trillion a new record – up 100% YoY and up 10% from the Q1 2025 record of €4.68 trillion.
- The similar CCP QoQ growth rates may indicate that the swing to Eurex from the 2025 go live of the Active Account Requirement may be ending. For further analysis, see the upcoming Q2 rates CCP competition blog.
Q2 2026 saw EONIA OIS at 72.2% of the total – second only to its 73.8% share in Q4 2024.
GBP OIS (SONIA)
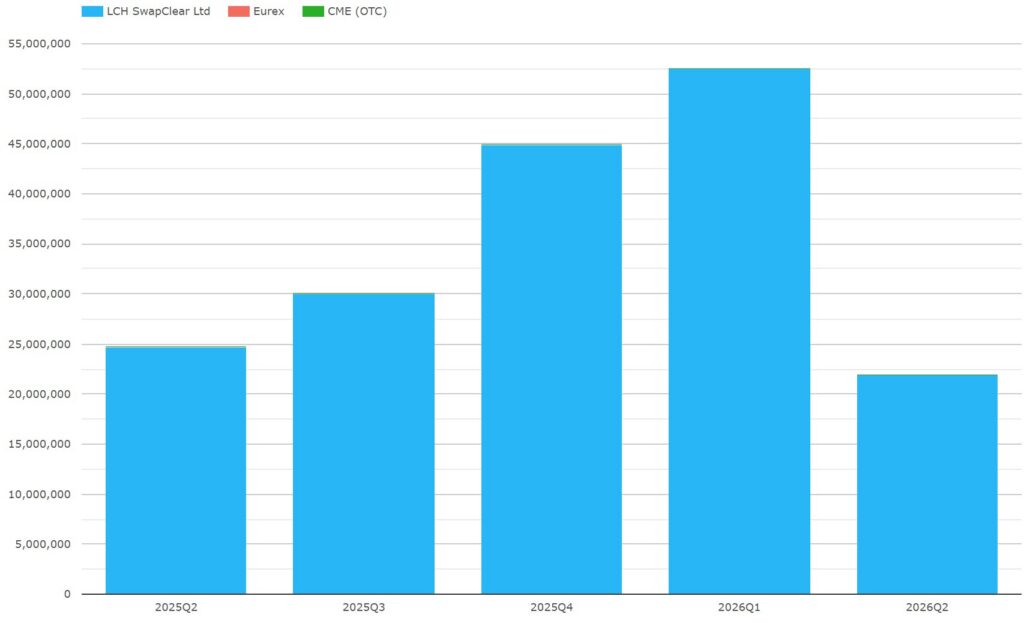
Chart 3: GBP OIS volumes (single-sided gross notional in GBP millions). Source: CCPView
Chart 3 shows that, in Q2 2026, GBP SONIA OIS totaled £22.0 trillion – down 11% YoY and down 58% from the Q1 2026 record of £52.5 trillion. We would gladly hear views on causes of the substantial percentage drop in volume. At an FX rate of 1.323, the total is equivalent to US$29.1 trillion.
JPY OIS (TONA)
Here, we exclude the sustained small volume of JPY DTIBOR IRS which is well below 1% of JPY swaps volume.
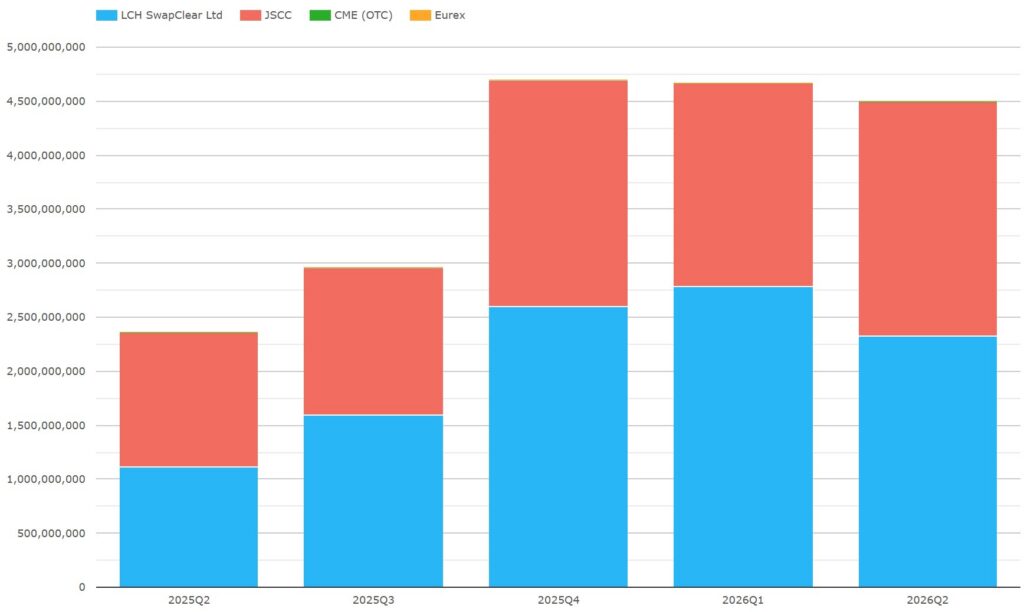
Chart 4: JPY OIS volumes (single-sided gross notional in JPY millions). Source: CCPView
Chart 4 shows that, in Q2 2026, JPY TONA OIS totaled ¥4,495 trillion – up 91% YoY but down 3.7% QoQ and down 4.3% from the Q4 2025 record of ¥4,669 trillion. At an FX rate of 162, the total is equivalent to US$27.7 trillion.
- LCH SwapClear had ¥2,331 trillion – up 110% YoY but down 16% QoQ from the Q1 2026 high of ¥2,787 trillion.
- JSCC had ¥2,164 trillion a new record level – up 73% YoY and up 2.9% from its Q4 2025 high of ¥2,102 trillion.
The disparity between the two CCPs’ QoQ growth indicates a comeback in market share by JSCC which we will analyze further in the upcoming Q2 rates CCP competition blog.
AUD IRS (BBSW) and OIS (AONIA)
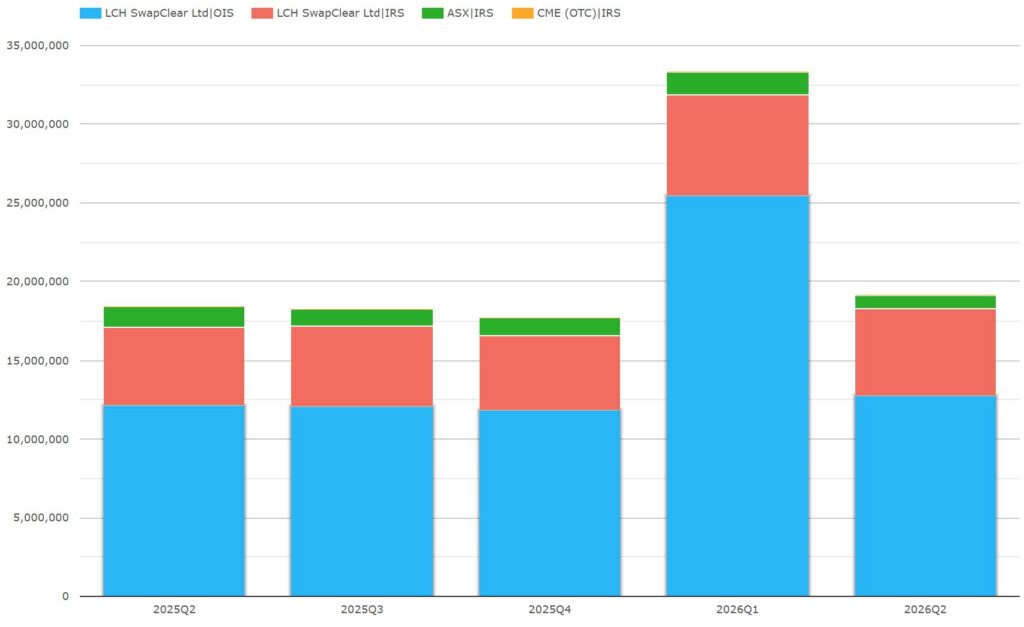
Chart 5: AUD IRS and OIS volumes (single-sided gross notional in AUD millions). Source: CCPView
Chart 5 shows that, in Q2 2026, AUD IRS and OIS totaled A$19.13 trillion – up 4% YoY but down 43% from the Q1 2026 record of A$33.3 trillion. AONIA OIS was 67% of the total. At an FX rate of 1.45, the total is equivalent to US$13.2 trillion.
- LCH SwapClear had A$18.2 trillion – up 6.7% YoY but down 43% from the Q1 2026 record of A$31.9 trillion.
- ASX had A$890 billion – down 31% YoY and down 38% from the Q1 2026 record of A$1.44 trillion.
Q2 2026 saw AONIA OIS at 66.6% of the total – down from its peak share of 76.3% in Q1 2026.
CAD OIS (CORRA)
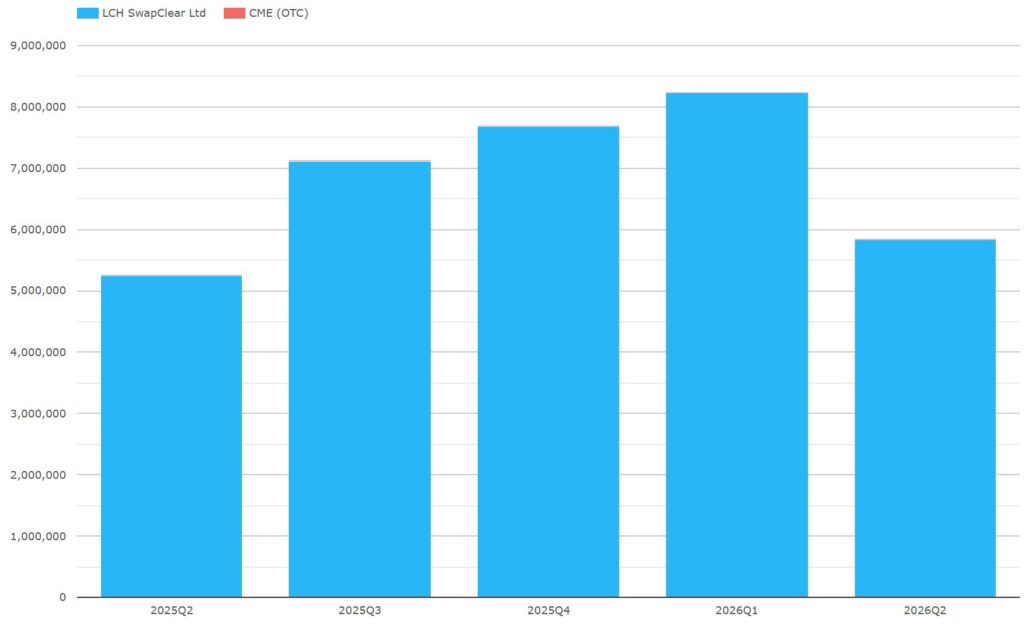
Chart 6: CAD OIS volumes (single-sided gross notional in CAD millions). Source: CCPView.
Chart 6 shows that, in Q2 2026, CAD CORRA OIS totaled C$8.07 trillion – up 11% YoY but down 29% from the Q1 2026 record of C$11.3 trillion. At an FX rate of 1.42, the total is equivalent to US$5.68 trillion.
Non-major currency IRS, OIS, and ZCS
We chart all three time-zones’ non-major currencies cleared swap activity in a single chart. Non-major currencies made up about 10% of the Q2 2026 all-currency total volume. Here we include zero coupon swaps (ZCS) because, in Q2 2026, ZCS were 95% of BRL swaps and 61% of CLP swaps, but only 2.7% of CZK swaps and below 0.4% for all other currencies.
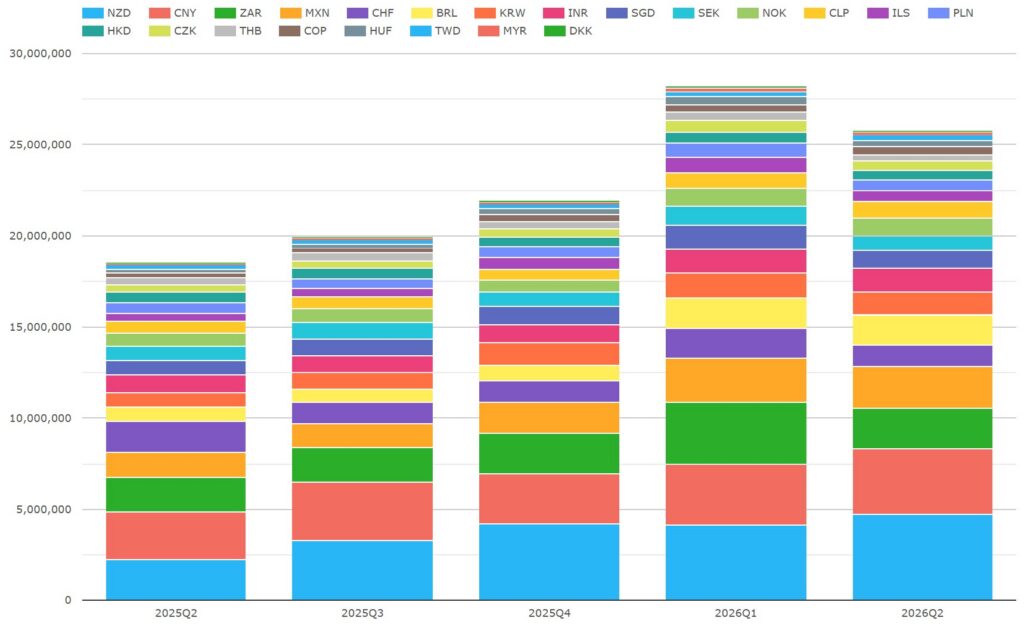
Chart 7: Non-major currency IRS, OIS, and ZCS volumes (single-sided gross notional in US$ millions). Source: CCPView.
Chart 7 shows that, in Q2 2026, volumes of non-major currency IRS, OIS and ZCS continued above the levels of the last three quarters of 2025 with a total of US$25.8 trillion – up 39% YoY but down 8.6% QoQ from the Q1 2026 record of US$28.2 trillion.
- YoY volume growth came in all currencies except CHF, SEK, HKD, and THB.
- QoQ volume growth came only in NZD, CNY, INR, NOK, CLP, COP, and TWD – each setting a new highest quarter.
The top eight currencies were US$18.2 trillion or 71% of the non-major currency volume – up 48% YoY but down 5.4% QoQ from the Q1 2026 record of US$19.3 trillion.
- NZD was the largest currency at US$4.69 trillion – up 108% YoY.
- CNY was next largest with US$3.63 trillion – up 62% YoY.
- MXN had US2.32 trillion – up 62% YoY but down 4.4% QoQ.
- ZAR cleared US$2.21 trillion – up 17% YoY but down 35% QoQ.
- BRL showed US$1.63 trillion – up 96% YoY but down 0.9% QoQ.
- INR saw US$1.34 trillion – up 41% YoY.
- KRW yielded US$1.21 trillion – up 56% YoY but down 14% QoQ.
- CHF was US$1.19 trillion – down 27% YoY.
The remaining fourteen currencies (NOK, SGD, CLP, SEK, ILS, PLN, HKD, CZK, COP, THB, HUF, TWD, MYR, and DKK) made up US$7.55 trillion (29%) of the non-major currency volume – up 22% YoY but down 16% from the Q1 2026 record of US$8.96 trillion.
- Notably, MYR grew much faster than other currencies at 119% YoY having only started clearing in Q2 2025.
That’s it
The seven charts here gave us a global overview of all currencies Q2 2026 core cleared rate swaps volumes.
The volumes in CCPView cover many more cleared instruments, volume metrics, and analysis parameters.
- Cleared instruments also include exchange traded futures and options and cash US Treasuries.
- Volume metrics also include trade count / DV01 / average daily volume (ADV), open interest (OI), OI change, and notional unwound/matured.
- Analysis parameters also include day / week / month / year, exchange, product subtype, tenor, and activity type (meaning D2C or D2D trade).
For more details, please contact us for a CCPView demonstration.