This blog covers credit derivatives (CRD) trading volumes in March 2026, both at CCPs and as reported in the US.
We sourced the charts and statistics from CCPView, SDRView and SBSDRView.
Key takeaways
- Credit default index swap volumes saw big year-on-year (YoY) increases in March 2026 from both CCPs and SDRs:
- USD CDX by 46 and 44 percent respectively.
- EUR iTraxx by 51 and 68 percent respectively.
- JPY iTraxx by 9.8 and 29.4 percent respectively.
- The higher growth percentages in SDR iTraxx volumes than in CCP iTraxx volumes indicate that US firms powered the growth.
- Swaption volumes (mostly uncleared) in March 2026 saw USD CDX flat YoY while EUR iTraxx jumped YoY by 133 percent.
- After recent LCH advances, ICE’s cleared USD CRD share settled near 91 percent in USD, while ICE’s EUR CRD share was 74 percent in Q1 2026 and Q3 2025 after being lower in both Q2 and Q4 2025.
Notes on CRD volumes
We focus on the months of March and September because the standardized CRD maturity dates on the two months’ IMM dates prompt peaks in rollover trading. See Q3 2025 CRD volumes blog for more details.
JSCC’s clearing process has a procedural lag after trade execution which shifts the JPY cleared CRD peak, and the statistical focus here, to April and October (though SDR volumes still peak in March and September).
US-reported CRD are split between “swap data repositories” (SDRs) where based on indexes or on baskets with more than ten names and “security-based swap data repositories” (SBSDRs) where based on single-names or on baskets with ten names or less.
We limit to USD, EUR, and JPY, which make up nearly all CRD volumes. SDRView / SBSDRView users may wish to explore the much smaller volumes of non-index trades in BRL, CNY, IDR, and INR, among others.
USD CRD
We start with cleared CRD.
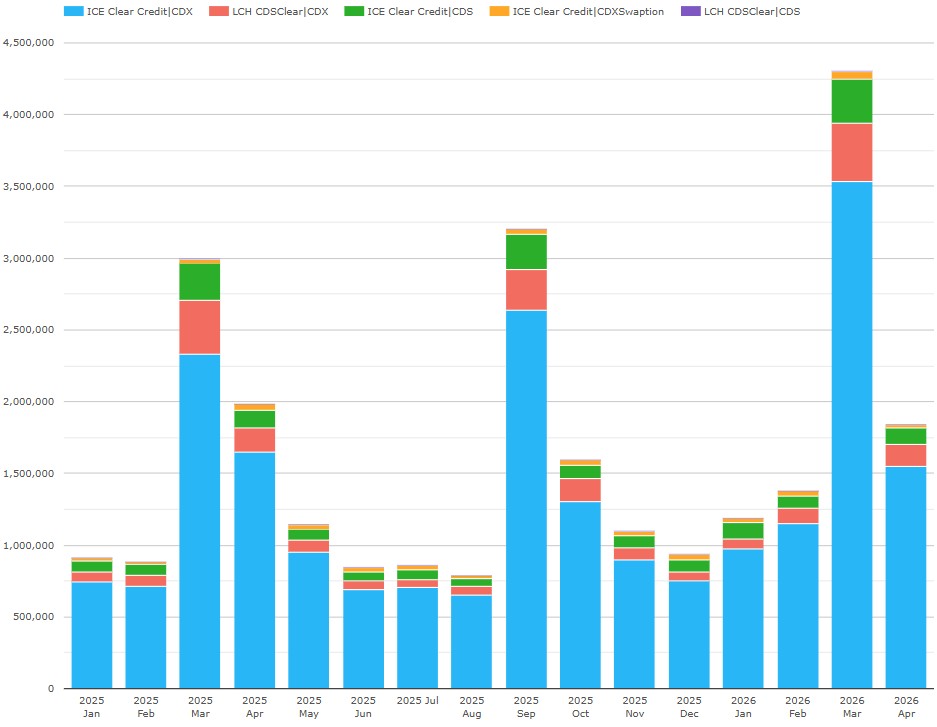
Chart 1: cleared USD CRD by CCP and product (notional USD millions). Source: CCPView
Chart 1 shows the breakdown by product and CCP of the new record total of $4.31 trillion of cleared USD CRD in March 2026 (also shown in Chart 1) – up 44 percent year-on-year (YoY), and up 34 percent half-on-half (HoH) from the previous record $3.2 trillion set in September 2025.
- CDX were $3.94 trillion – up 46 percent YoY and up 35 percent HoH.
- Single-names (CDS) were $310 billion – up 18 percent YoY and up 25 percent HoH.
- CDX swaptions were $52.9 billion – up 80 percent YoY and up 41 percent HoH.
Next: SDR-reported CRD.
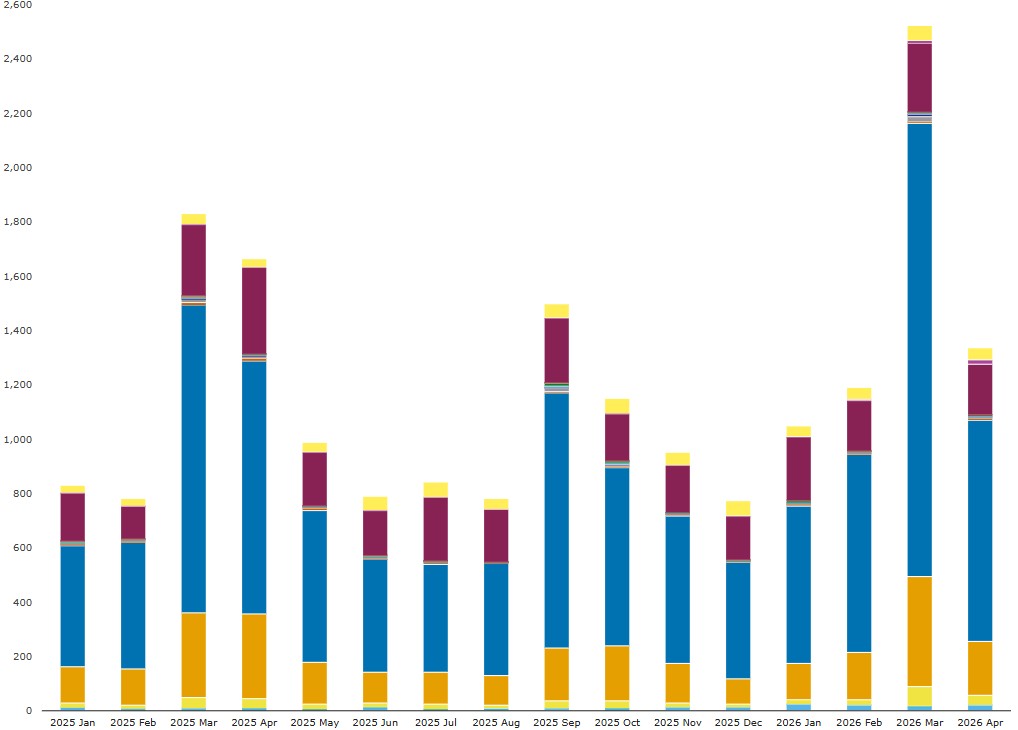
Chart 2: SDR-reported USD CRD by product type (notional USD billions). Source: SDRView
Chart 2 shows that March 2026 SDR-reported USD CRD totaled $2.52 trillion – up 38 percent YoY and up 68 percent HoH.
- Indexes were $2.18 trillion – up 44 percent YoY and up 84 percent HoH. The larger index types were:
- Investment grade CDX (dark blue) with $1.67 trillion.
- High yield CDX (orange) at $407 billion.
- Emerging markets CDX (muted yellow) at $70.8 billion.
- Swaptions (mostly CDX swaptions in claret) totaled $263 billion – down 1.3 percent YoY but up 10.5 percent HoH.
- Total return swaps (bright yellow) were $55.8 billion – up 47 percent YoY and up 5.9 percent HoH.
- Exotics (pale blue) were $15.2 billion – up 96 percent YoY and up 135 percent HoH.
- Index tranches made up the remaining $7.5 billion – up 9.0 percent YoY but down 55 percent HoH.
Now: SBSDR-reported CRD.
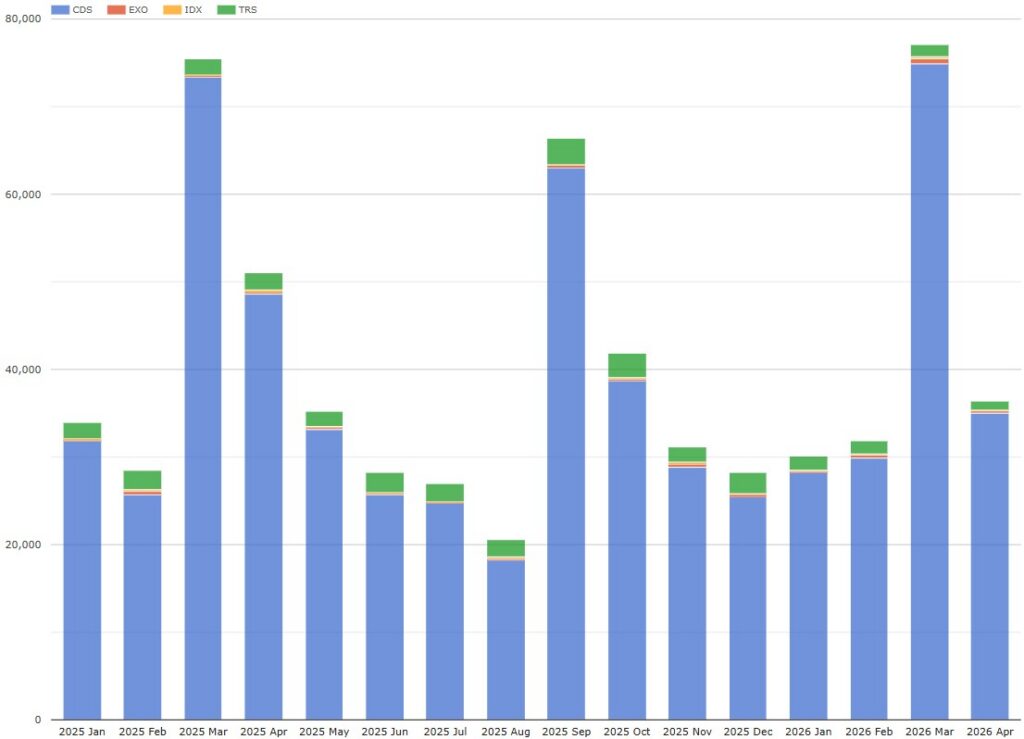
Chart 3: SBSDR-reported USD CRD by product type (notional USD millions). Source: SDRView
Chart 3 shows that March 2026 SBSDR-reported USD CRD totaled $77.1 billion – up 2.2 percent YoY and up down 16 percent HoH.
- Single names (CDS, in blue) were $74.9 billion – up 2.1 percent YoY and up 18.8 percent HoH.
- Total return swaps (TRS, in green) were $1.43 billion – down 19 percent YoY and down 52 percent HoH.
Overall, USD CDX increased YoY by 44+ percent while (mostly uncleared) swaptions were flat YoY.
Lastly: CCP shares.
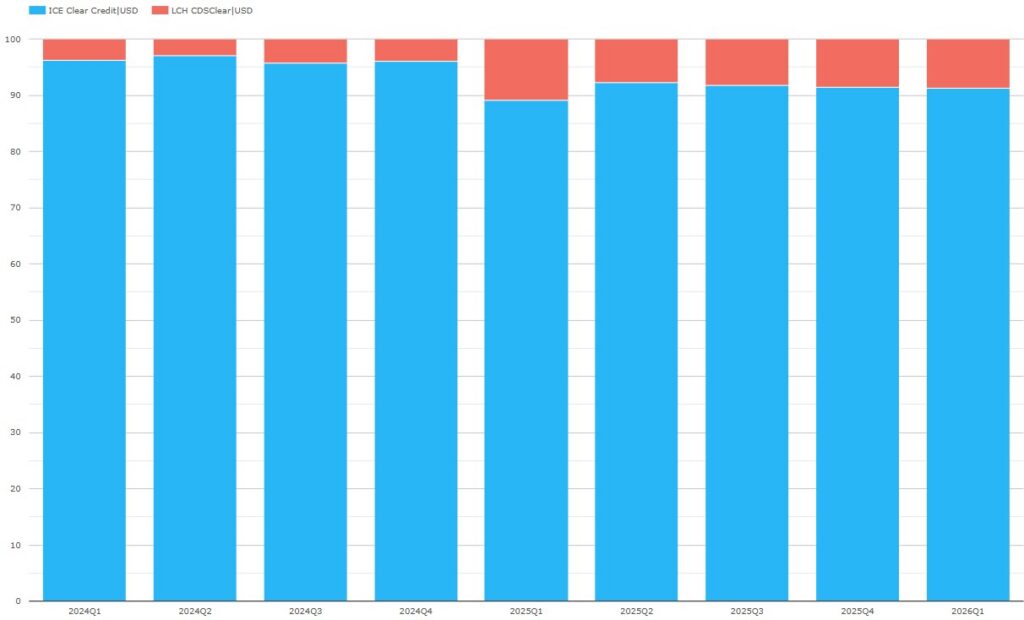
Chart 4: cleared USD CRD CCP share (percentage of USD notional). Source: CCPView
Chart 4 shows that ICE’s share of USD CRD has settled near to Q1 2026’s 91.2 percent – up 2.1 percent YoY but down 0.4 percent HoH, after LCH CDSClear roughly doubled its share between 2024 and 2025.
EUR CRD
First: cleared CRD.
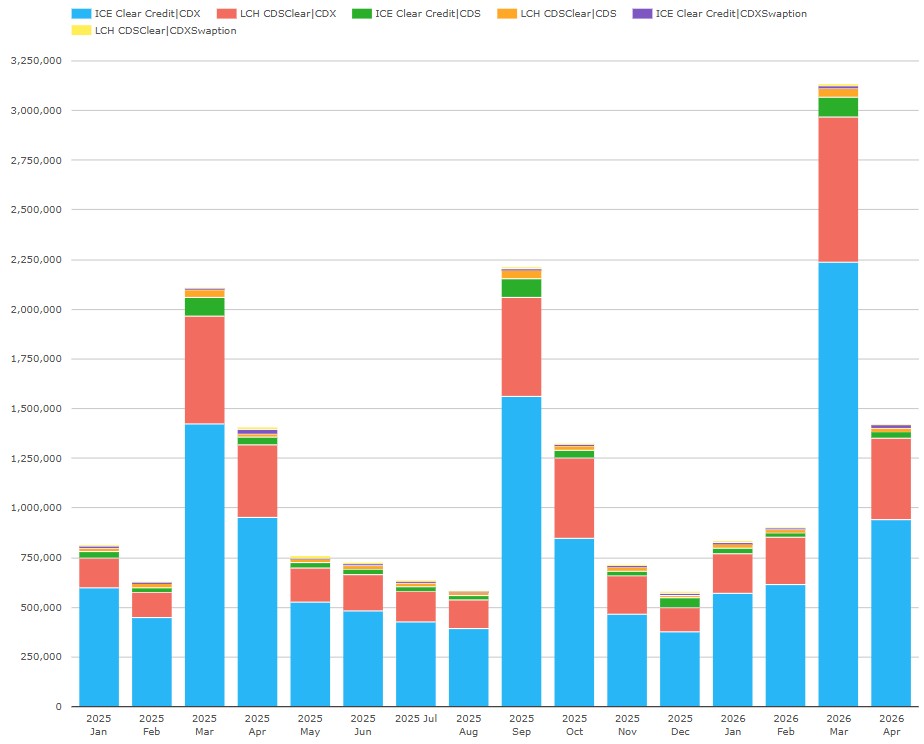
Chart 5: cleared EUR CRD by CCP and product (notional USD millions). Source: CCPView
Chart 5 shows the breakdown by product and CCP of the new record total of $3.14 trillion of cleared EUR CRD in March 2026 (also shown in Chart 1) – up 49 percent YoY and up 42 percent HoH from the previous record month of $2.21 trillion set in September 2025.
- iTraxx indexes (CDX) were $2.97 trillion – up 51 percent YoY and up 44 percent HoH.
- Single-names (CDS) were $144 billion – up 9.1 percent YoY and up 7.3 percent HoH.
- iTraxx swaptions (CDXSwaption) were $23.5 billion – up 133 percent YoY, and up 35 percent HoH.
Now: SDR-reported CRD.
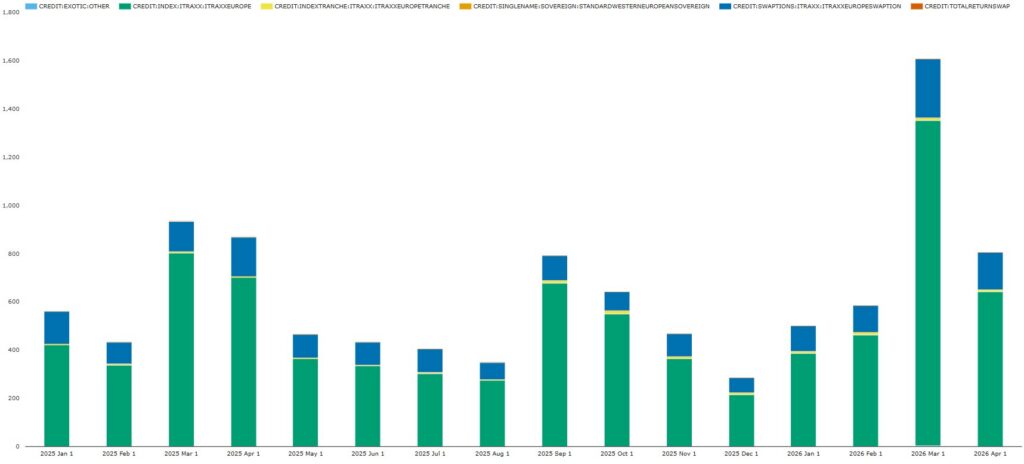
Chart 6: SDR-reported EUR CRD by product type (notional USD billions). Source: SDRView
Chart 6 shows that March 2025 SDR-reported EUR CRD totaled $1.61 trillion – up 72 percent YoY and up 103 percent HoH.
- iTraxx Europe indexes were $1.35 trillion – up 68 percent YoY and up 100 percent HoH.
- iTraxx Europe swaptions were $244 billion – up 95 percent YoY and up 136 percent HoH.
- The remaining volume was made up of iTraxx Europe tranches at $9.69 billion, total return swaps at $1.38 billion, and exotics at $1.15 billion.
Next: we look at SBSDR-reported CRD.
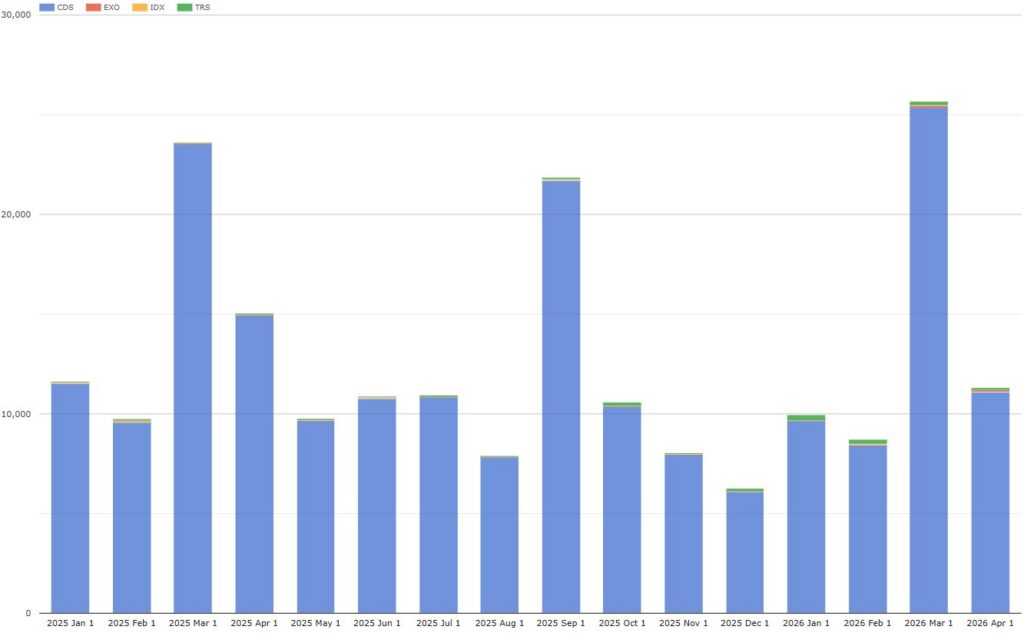
Chart 7: SBSDR-reported EUR CRD by product type (notional EUR millions). Source: SDRView
Chart 7 shows that March 2026 SBSDR-reported EUR CRD totaled $25.7 billion – up 8.8 percent YoY and up 17 percent HoH. Almost all were single-names (CDS).
Finally: CCP shares.
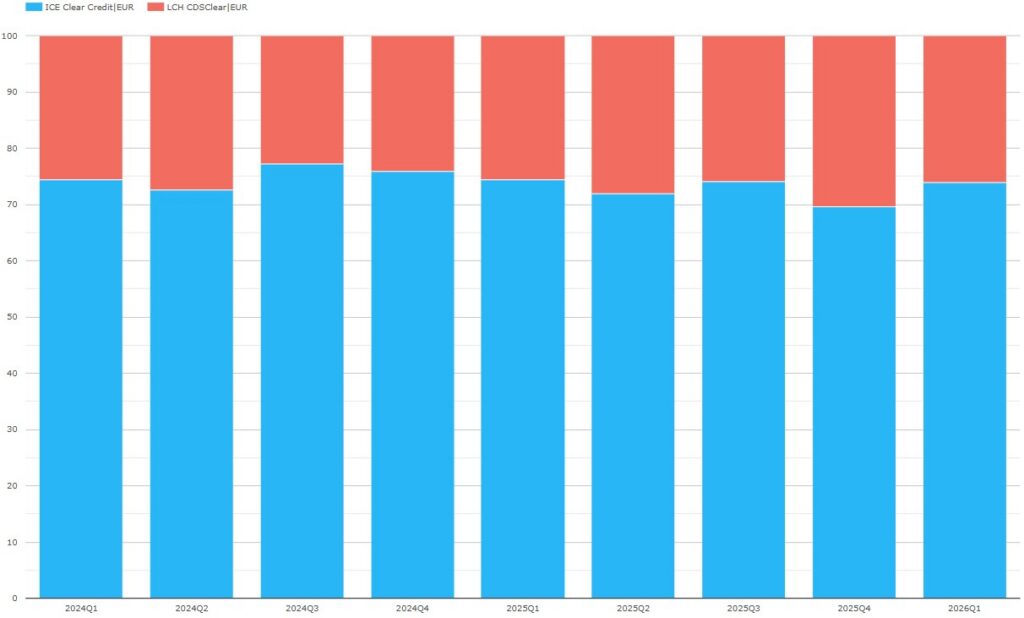
Chart 8: cleared USD CRD CCP share (percentage of USD notional). Source: CCPView
Chart 8 shows that ICE’s share of EUR CRD was 73.9 percent in Q1 2026. While ICE’s Q1 and Q3 shares settled near 74 percent, Q2 and Q4 show a downward trend with Q4 2025 at 69.4 percent – LCH having gained 6.3 percent YoY and 2.4 percent HoH.
Overall, iTraxx swaps SDR-reported volumes outgrew CCP-reported volumes by 17 percentage points, suggesting that US financial firms volumes outgrew others. Also note that iTraxx swaptions comfortably outgrew indexes.
JPY CRD
First: cleared CRD.
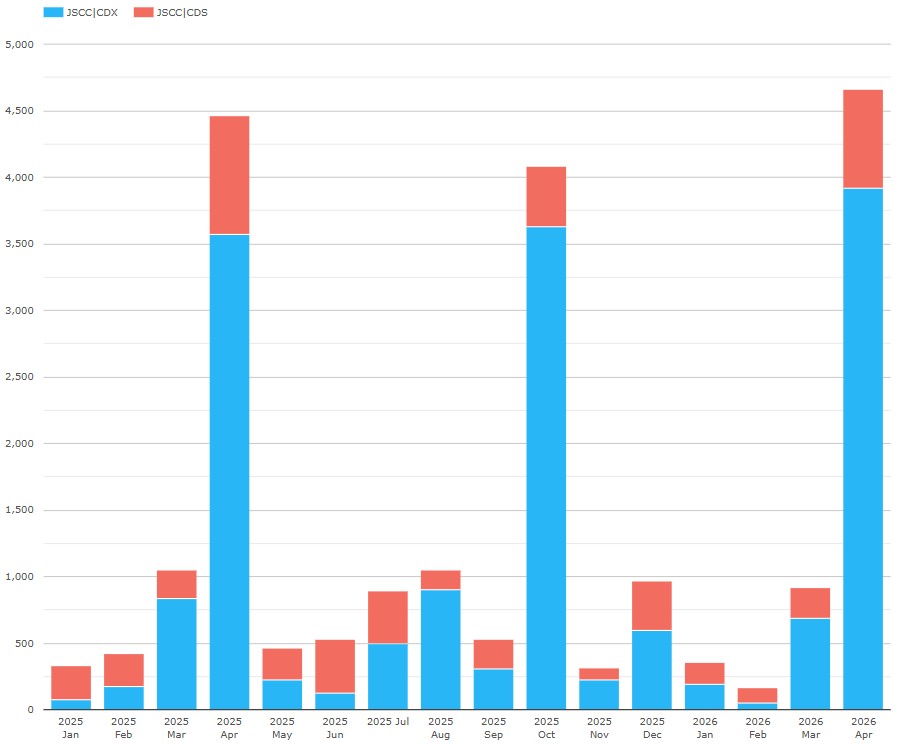
Chart 9: JPY CRD by CCP and product (notional USD millions). Source: CCPView
Chart 9 shows the breakdown by product and CCP of the new record total of $4.66 billion of cleared JPY CRD in April 2026 (also shown in Chart 1) – up 4.4 percent YoY from the previous record $4.47 billion set in April 2025 and up 14 percent HoH from October 2025.
- iTraxx (CDX) were $3.92 billion – up 9.8 percent YoY and up 8.1 percent HoH.
- Single-names (CDS) were $746 billion – down 17 percent YoY but up 64 percent HoH.
Now: SDR-reported CRD.
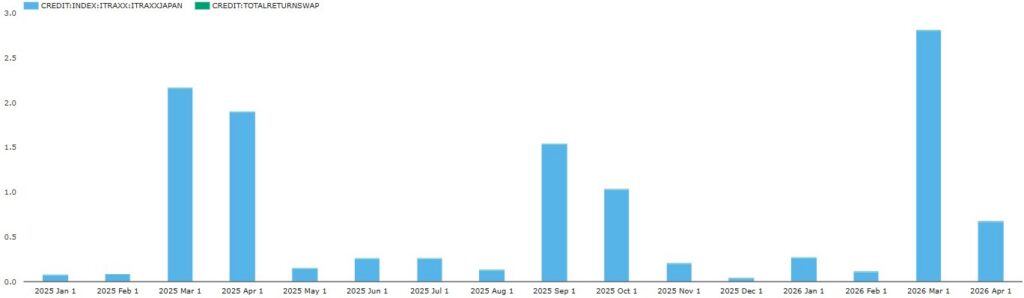
Chart 10: SDR-reported JPY CRD by product type (notional USD billions). Source: SDRView
Chart 10 shows that April 2026 SDR-reported JPY CRD totaled $2.80 billion – up 29 percent YoY and up 82 percent HoH. Almost all were iTraxx Japan trades.
Next: SBSDR-reported CRD.
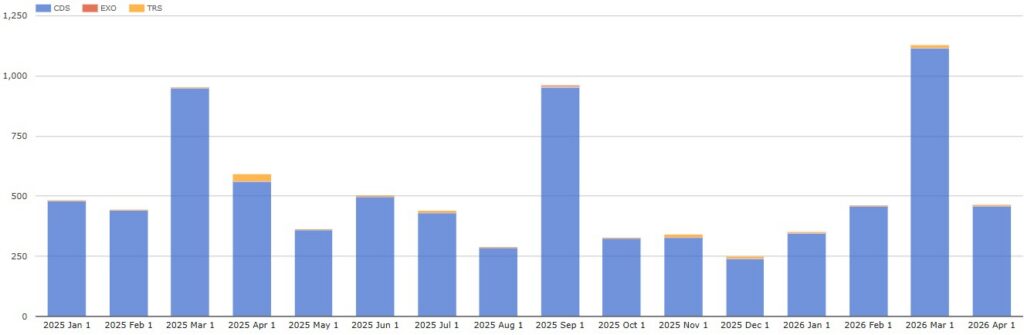
Chart 11: SBSDR-reported JPY CRD by product type (notional USD millions). Source: SDRView
Chart 11 shows that April 2026 SBSDR-reported JPY CRD totaled $1.13 billion – up 19 percent YoY and up 18 percent HoH. Almost all were single-names.
JSCC had all cleared JPY CRD, so I skip the chart.
As with EUR, JPY iTraxx swaps SDR-reported volumes outgrew CCP-reported volumes by 20 percentage points, suggesting that US financial firms outgrew others in volume.
That’s It
We used 11 charts to cover materially cleared and US-reported CRD.
You can find a lot more data in CCPView, SDRView and SBSDRView: click each link to see a summary of the range of data available.
Contact us if you are interested in a subscription.