- Swap Spreads, aka Spreadovers, have seen record amounts of activity in the past week.
- The move in prices has been large, with long-dated swap spreads generally heading more negative.
- Swap Spreads are 4.5-7 basis points more negative and trading in all time record volumes.
(FT Alphaville came up with the “apocolypse/swapscalypse” first. I am not that clever).
Hello Swap Spreads
As the link to Alphaville shows, the market narrative is adding USD swap spreads to the “people are worried about the basis trade” theme. Whilst there is potentially more notional tied to the basis between cash USTs and CME-traded futures than USD Swap Spreads at any one time, Swap Spreads are another type of basis trade and have a lot more term risk associated with them.
In terms of context, it may just be that a sell-off in Swap Spreads is the pain trade du jour. Or we may be witnessing a repricing in expectations that the Supplementary Leverage Ratio will change under Trump. More broadly, we may also be seeing signs that the relative credit-worthiness of USTs themselves are being reassessed. These three things together have ended up driving a lot of trading volumes in USD Spreadovers over the past week.
Fortunately, we cover the USD Spreadovers market in depth here on the Clarus blog. If you are new to this area of the Rates market, I define Spreadovers as;
Trading strategy; to take a view on the difference in rates between an Interest Rate Swap and a Government Bond.
The blog covers multiple aspects of the Spreadover market, including;
In addition, we monitored the move in Spreadovers in real time on our Election Live blog.
Swap Spreads Data
SDRView provides all the data you need on Swap Spreads, volumes and market moves. The tickers you need to know are:
- USSFCT5 for 5 year swap spreads
- USSFCT10 for 10 year
- USSFCT30 which REALLY moved (30 years)
First up, 10Y Swap Spreads;
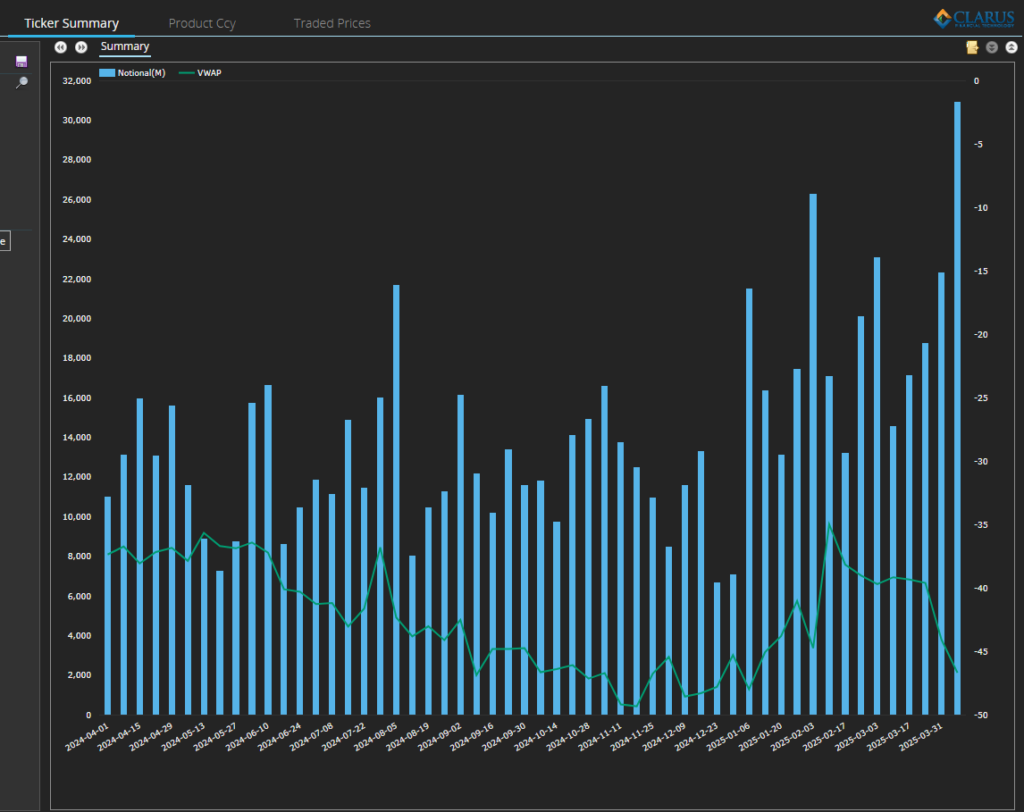
Showing;
- Swap Spreads have been hit with a big fat “YOURS!” in the past week.
- AKA Spreadovers, Swap Spreads have really sold-off, turning sharply more negative and trading in really large sizes.
- At least $31bn of 10Y traded last week, more than any other week since at least 2020!
- 10Y spreadovers traded over 600 times last week, nearly 2.5 times as active as their typical 250 trades/week.
- The Volume Weighted Average has moved 7 bp more negative over the past two weeks.
Risk.net reports that there was an expectation that regulatory reform would see USTs exempt from the Leverage Ratio (Supplementary Leverage Ratio in the US). This would mean that large banks would not have to hold capital against USTs, meaning they could hold USTs on their balance sheet more efficiently than holding cleared interest rate swaps. That would increase demand for USTs, lowering their yields and potentially moving UST yields below swaps again. The result? Some market positioning/expectation for positive (or less negative) swap spreads.
The market has an intrinsic ability to hunt out pain trades when markets are volatile. The path of least resistance for Swap Spreads has therefore been to head more negative, with yields on USTs rising more than swaps.
30Y Swap Spreads
IF (that is a big IF) USTs are indeed to be exempt from the SLR, then 30Y swap spreads should see the biggest move. That is because more capital has to be held against longer maturity swaps than shorter ones. So the most efficient use of capital is to use long-dated USTs rather than swaps for banks to hold interest rate risk (remember this only applies to banks. Hedge Funds and Buyside are not covered by the SLR because they are not banks).
And, indeed, the weekly VWAP chart for 30Y swaps spreads shows a huge amount of activity last week:
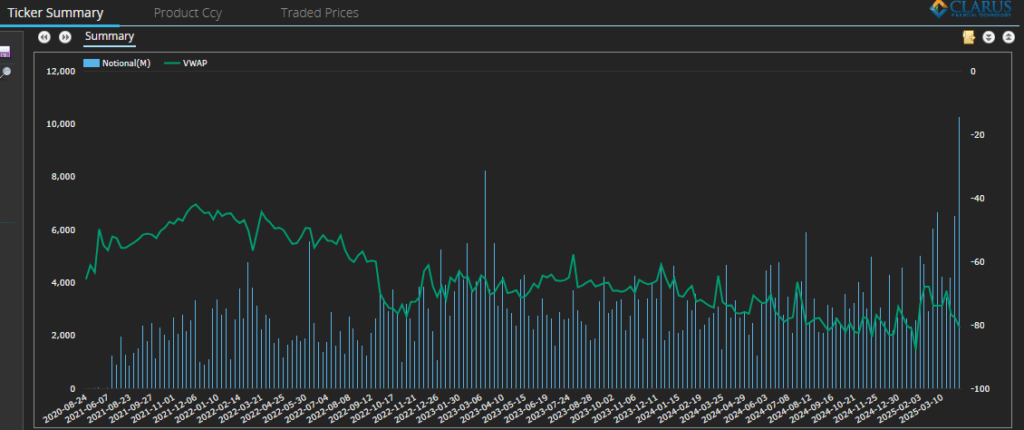
Showing;
- At least $10bn of 30Y traded last week, more than any other week since at least 2020.
- 30Y spreadovers traded over 425 times last week, 3 times as active as their typical 135 trades/week.
- The Volume Weighted Average has moved 4.5 bp more negative over the past two weeks.
And for those fond of round numbers, we even saw -100bp trade in 30Y spreads on 8th April:
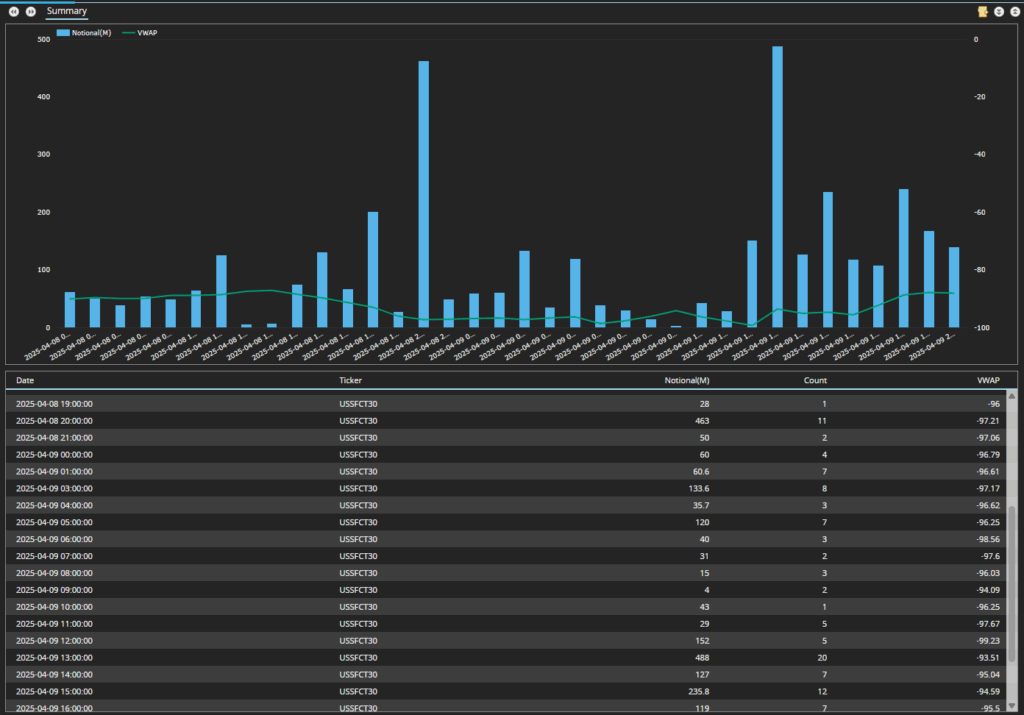
A -100bp print feels meaningful, particularly when the volumes transacted around the print are large. I did have a concern that the notional amounts are at all time records only because of the increase in Block Sizes. But we are also seeing record trade numbers, so it really was a record week in the market.
Balance Sheet
Some of this blog may over-state the obvious. For example, you have to have cash to buy US Treasuries, and they are an easy to liquidate security when you need to raise funds. That can explain some of the price move, but I am not sure it explains why such large volumes are trading right now. For me, the combination of balance sheet usage, capital and liquidity continues to be fascinating, and I am pleased that we have the data to see it play out in the markets in “real-time”.
In Summary
- Surge in Swap Spread Trading: USD swap spreads (aka “Spreadovers”) saw record trading activity last week, with $31bn in 10Y and $10bn in 30Y notional traded—both the highest since at least 2020—driven by sharp moves more negative and a surge in trade count.
- Market Drivers: The sell-off in swap spreads may reflect a mix of factors—market pain trades, speculation around changes to the Supplementary Leverage Ratio (SLR) under Trump, and a possible reassessment of U.S. Treasury creditworthiness.
- Regulatory Expectations: If USTs become exempt from the SLR, banks would favor holding Treasuries over swaps, especially at long maturities like 30Y, due to more efficient capital treatment—explaining why long-dated spreadovers saw the most pronounced moves.