Analysing existing datasets in new and novel ways, often throws up interesting insights and questions which help with our understanding of the real world and in turn help us to make better decisions.
Today I wanted to showcase a new feature in SDRView, that demonstrates this, the Ticker Summary View.
SDRView has transaction level data for OTC Derivatives, made public under CFTC Regulations, which consists of more than 50 fields for each transaction, allowing us to determine the time, size, price and product/instrument and more of what traded.
Unlike Bonds or Equities, there are no security intruments as such for Swaps and OTC Derivatives, rather a set of fields, that allow us to determine if it is a standard trade and the most common nomenclature/symbology for standard Swap instruments is the Bloomberg Ticker, available at OpenFIGI.
Our new Ticker Summary view uses this to conveniently access a large historical record of trades for price and volume summary measures.
Let’s take a look at what it shows.
Swap Spreads
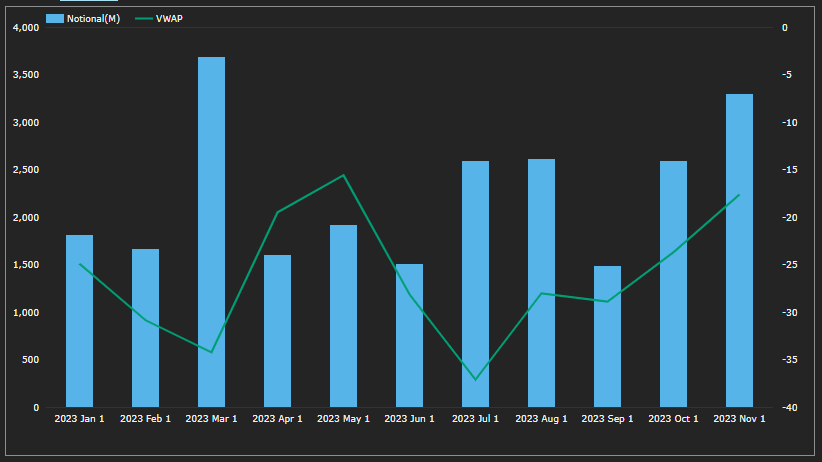
USD Swaps in the inter-dealer market trade as Spreads over Treasuries, a Swap Spread that for many years now has been negative. I won’t go into why, just Google “Why are Swap Spreads Negative”, but lets look at the 5Y, which has the Bloomberg Ticker USSFCT05, for the standard SOFR Swap, having taken over from the well known USSS5, the legacy Spreadover for Libor.
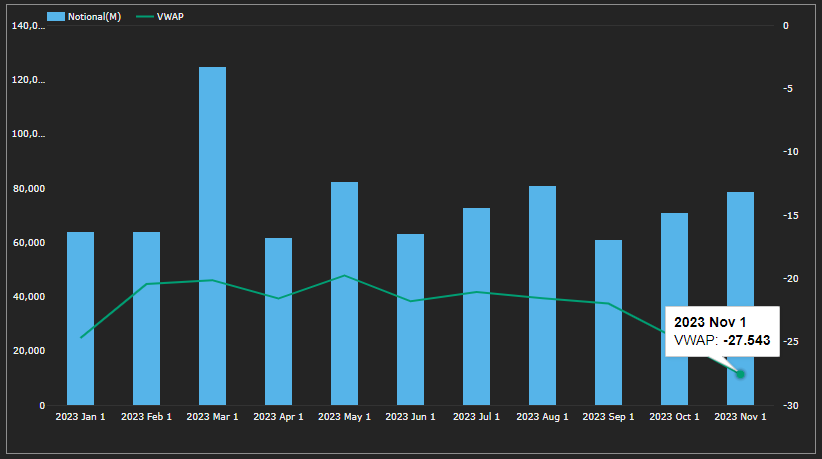
- Showing the gross notional transacted each month in 2023 (so far)
- And a Volume Weighted Average Price (VWAP) for the month
- Ending at -27.5 bps in Nov-23, starting at -24.7 in Jan, reaching to -19.7 in May
- Most months with $60-70 billion gross notional
- Mar-23 a stand-out month with > $125 billion
- Nov-23, close to $80 billion
- (Recall due to capped size rules, the true notional is likely to be 30% higher).
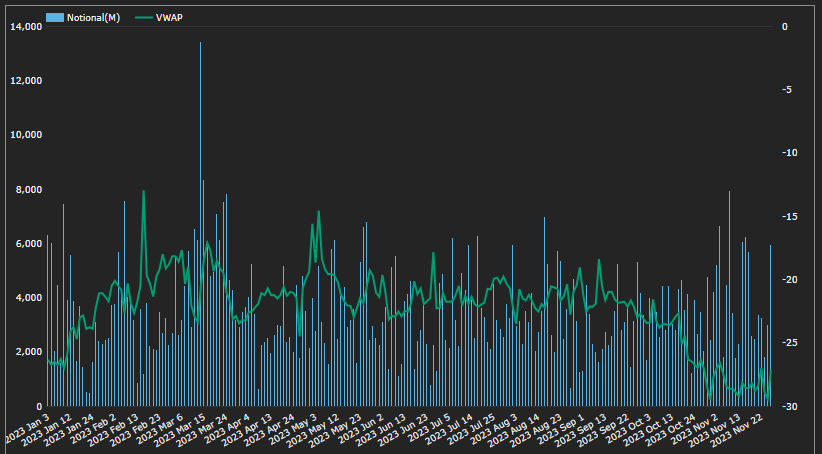
To get that chart, all I had to do was select the following:
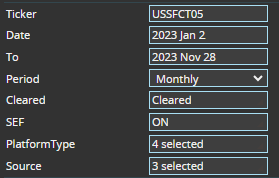
Eight simple parmeters and the query then searched millions of transaction records for the 9,000 that met my criteria, for which an aggregated monthly notional, VWAP (and trade count, not shown in the chart) is returned.
Not bad!
It is super simple to do the same query but return a weekly or daily time-series.
Showing more micro-structure with peaks and trought for volume or VWAP. The highest volme by far on 14-Mar-2023, the lowest spread in late November.
Next let’s look at a few other Swap trade types.
Curve/Switches
Trades which look to benefit from relative moves in tenors, Steepeners or Flatteners.
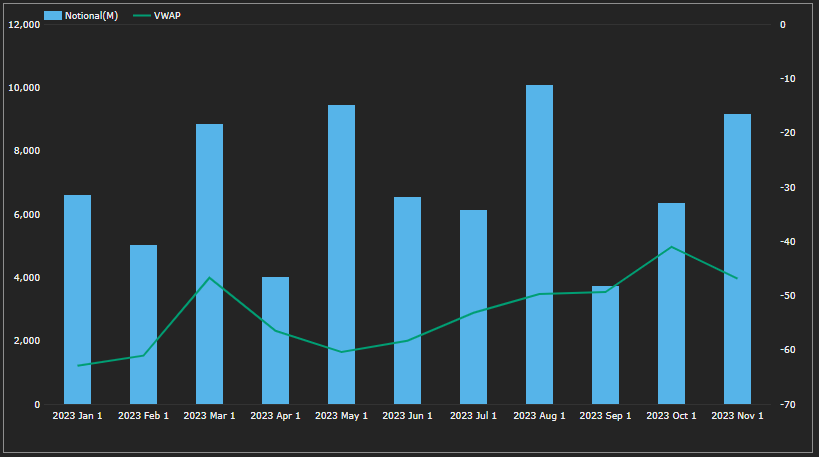
Two common ones are 2y10y and 10y30y.
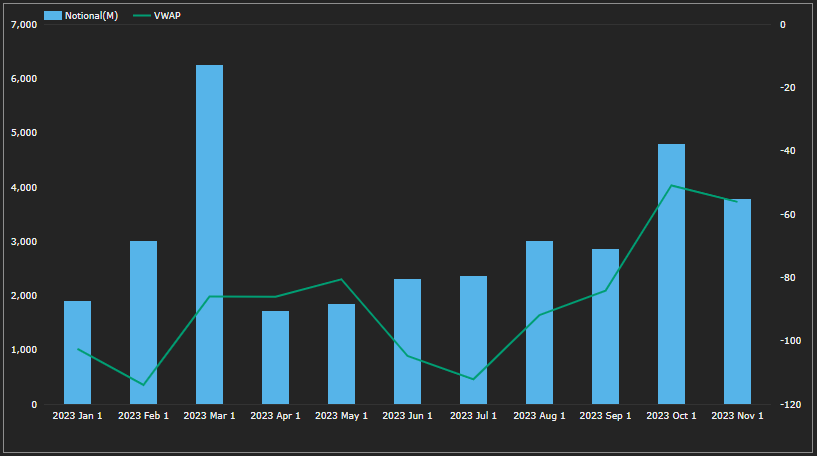
- Highest volume in Mar-23 of $6.3 billion
- (Note this is a package adjusted gross notional, so just the near leg summed, in this case 2Y and not the 5X it would be if we added up both legs of the trade).
- Lowest volume in Apr-23, with Oct-23 and Nov-23 on the up
- Most months with > 100 trades, Mar-23 the highest with 316
- The VWAP Spread widest in Feb23 at -114 bps and narrowest in Oct-23 at -50.8bps
- Highest volume in Mar-23 of $3.7 billion, Nov-23 close with $3.3 billion
- Most months with > 100 trades, Mar-23 the highest with 224
- The VWAP Spread widest in Jul-23 at -37 bps
- Narrowest in May-23 at -15.5, though Nov-23 is now at -17.5
Butterflys
See Mechanics of Spread and Butterfly Swap Packages for a definition of these 3 legged trades. We will look at two of the most common trades, 2y5y10y and 5y10y30y.
- March, May, August and November the highest months, with $9-$10 billion of notional
- An average of 60 trades per month, with 90 in the highest month
- VWAP Spread at -63 bps in Jan-23 and now -47 bps, close to the the low of -41 bps in Oct-23
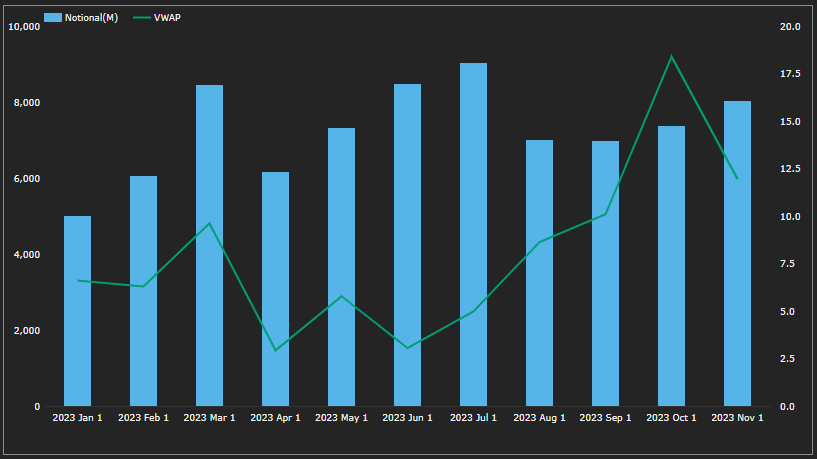
- March, June and July the highest months, with $8-$9 billion of notional
- An average of 100 trades per month, with 135 in the highest month
- VWAP Spread at 6.6 bps in Jan-23, 18.4 bps in Oct-23 and now 12 bps
Cross Currency Swaps
And before we end, we will use SDRView to look at just one Cross-Currency Swap, as this product is best left to Chris to do justice to the data in a future blog.
Lets look at EUR-USD 5Y, which is EUXOQQ5, a SOFR vs EuroSTR trade.
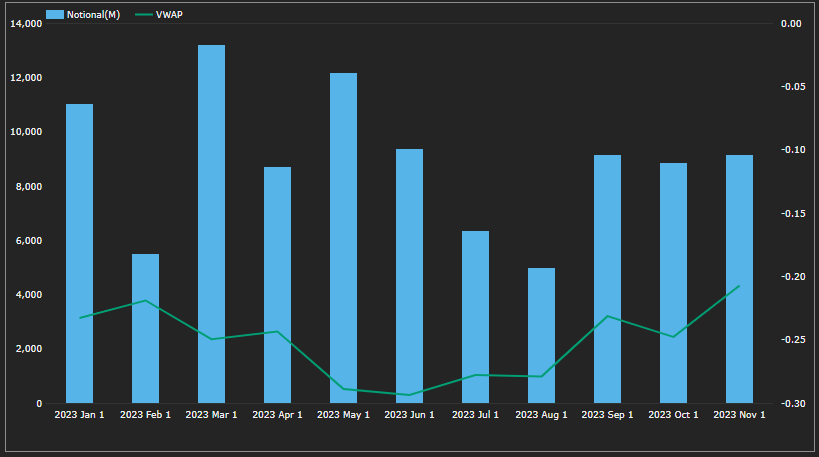
- March and May the highest months, with $13 billion and $12 billion notional
- An average of 114 trades per month, with a high of 195 in Mar-23
- VWAP Basis Spread at -23 bps in Jan-23, down to -29 bps mid-year and now -21 bps
Summary
The Ticker Summary View provides a time-series of Swap prices and volumes.
It is super simple to use.
Bloomberg Tickers facilitate the ease-of-use.
We search millions of transactions to get an instrument time-series.
Showing daily, weekly, monthly trends over time for price and volume.
Covering many types of Swaps including packages.
I forgot to mention, that there is also a Web API, one for next time.
That’s all for today.