Clearing Houses have published their latest CPMI-IOSCO Quantitative Disclosures:
- Initial margin for IRS steady in the range $250-270 billion range for 5 quarters
- Initial margin for CDS at $58 billion drifting down 3% QoQ and 12% YoY
- Initial margin for selected ETD at $440 billion up 5% YoY
- Initial margin increases at OCC, ICE Europe F&O, Eurex OTC IRS, LCH CDSClear, ASX CLF
- Explanatory Notes are now available in CCPView
- Other disclosures changing >20% highlighted below
Background
Under the CPMI-IOSCO Public Quantitative Disclosures, CCPs publish over two hundred quantitative data fields covering margin, default resources, credit risk, collateral, liquidity risk, back-testing and more.
CCPView has almost 6 years of these quarterly disclosures for 42 Clearing Houses, each with multiple Clearing Services, covering the period from 30 Sep 2015 to 30 Jun 2021. This disclosure data provides insights into trends over time at one CCP and comparisons between CCPs.
Initial Margin for IRS
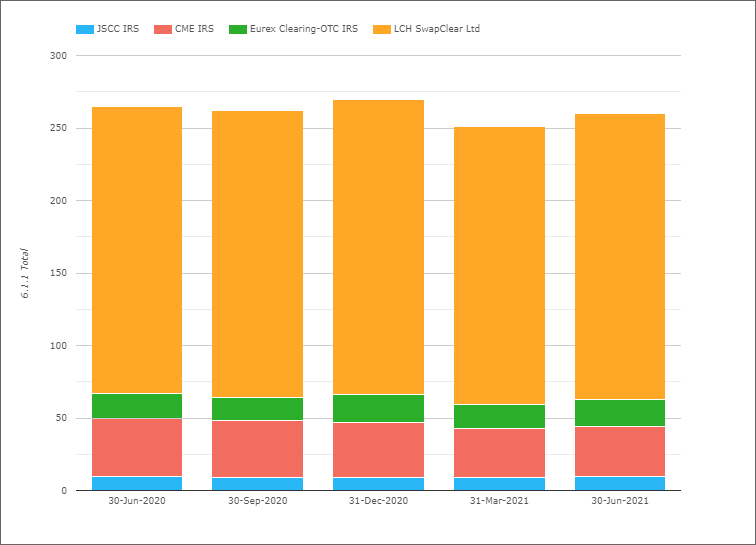
- Total IM for these four CCPs was $260 billion on 30-Jun-2021
- $9 billion or 3.5% higher than a quarter earlier (31-Mar-2021)
- $6 billion or 2% lower than a year earlier (30-Jun-2020)
- LCH SwapClear with $197 billion or £142 billion on 30-Jun-2021
- Is up 2.6% QoQ in USD terms or 2.2% in GBP terms
- While YoY, LCH SwapClear is down 0.5% in USD terms and 12% in GBP terms
- CME IRS with $33.9 billion, up 0.7% QoQ and down 16.2% YoY
- Eurex OTC IRS with $19 billion or €16 billion
- Up 16.6% QoQ in USD terms or 15% in EUR terms
- Up 9% YoY in USD terms or 2.6% in EUR terms
- JSCC IRS with $10 billion or Y1,100 billion
- Up 9.7% QoQ in USD terms or 9.4% in JPY terms
- Down 2.9% YoY in USD terms or down 0.5% in JPY terms
IM for IRS staying in the $250-270 billion range for over a year now, seemingly a new plateau and a marked change from the QoQ and YoY increases in the three years from 2017-2019.
Initial Margin for CDS
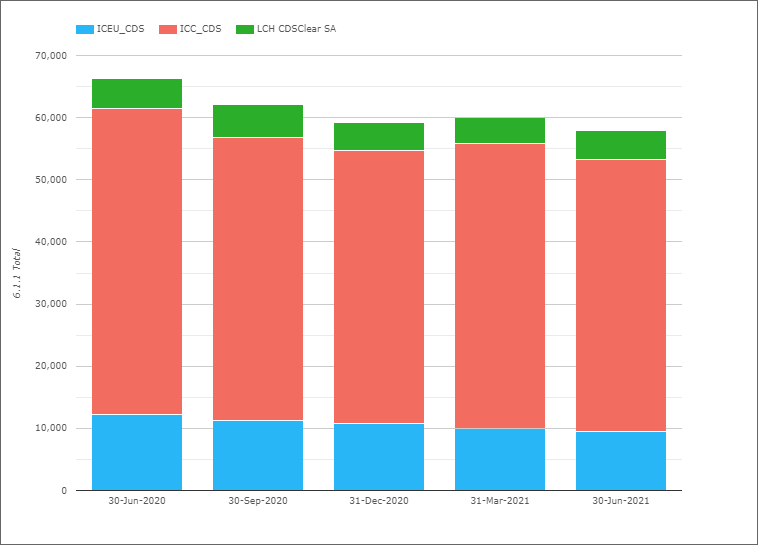
- Total IM for these three CCPs was $58 billion on 30-Jun-2021
- Down 3.4% QoQ and down 12.5% YoY in usd terms
- Up 1.5% from $59 billion on 31-Dec-2020
- ICE Credit Clear with $43.7 billion, down 4.7% QoQ and 11.3% YoY
- ICE Europe Credit with €8 billion, down 5.3% QoQ and 26% YoY.
- LCH CDSClear with €4 billion, up 9.3% QoQ and down 8% YoY.
Overall CDS IM continuing to drift down QoQ, whith only LCH CDSClear bucking the trend in the recent quarter.
Initial Margin for ETD
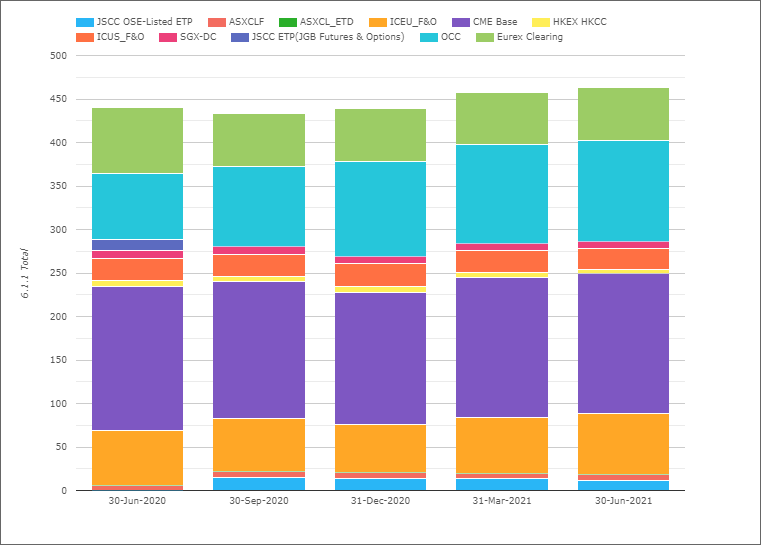
- Total IM for these CCPs was $443.6 billion on 30-Jun-2021
- Up 0.5% QoQ and up 5% YoY from 30-Jun-20
- (Note the chart shows slightly higher totals as the Eurex Clearing amount in the chart includes OTC IRS IM, which I exclude in my figures here)
- CME Base with $160 billion, down 0.6% QoQ and down 3% YoY.
- OCC with $116 billion, up 1.8% QoQ and up 52% YoY.
- ICE Europe F&O with $70.6 billion, up 11% QoQ and up 12% YoY.
- Eurex with $42 billion, down 2% QoQ and down 28% YoY.
- ICE US F&O $23.6 billion, down 4.3% QoQ and down 8.5% YoY.
- JSCC OSE Listed ETP with $10.9 billion, down 23% QoQ and down 10% YoY
- SGX-DC $8.5 billion, up 6% QoQ and down 9% YoY
- ASX CLF $6.6 billion, up 4.4% QoQ and up 7.7% YoY
- HKEX HKCC with $5.4 billion, down 15% QoQ and down 22% YoY
ETD IM rising YoY by 5% due to a large increase at OCC and increases at ICE Europe F&O and ASX CLF, which were more than the decreases resulting from all other CCPs.
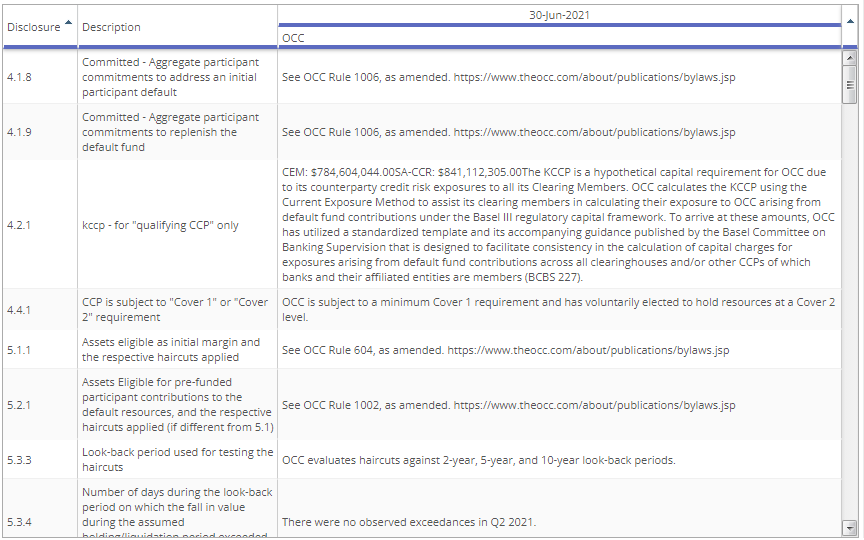
Explanatory Notes
A new feature we have recently added to CCPView is the ability to view any explanatory notes published by CCPs with their disclosures. Typically these can be in different documents, which we have now parsed and uploaded into our database. Users can now select the display type Notes and view these, as shown below for OCC for 30-Jun-2021.
Other Disclosures of Interest
Next let’s do a quick scan of 30-Jun-2021 disclosures highlighting a few with a change tolerance >20% outside the 3 year range of values:
- ASXCLF – 4.3.1 Cash deposited at central bank of issue was A$253 million versus A$165 million in the prior quarter and amounts below A$10 million for all prior quarters
- B3 – 4.1.5 Prefunded Aggregate Participants to Default Fund Post-Haircut Posted were $373 million, up from $147 million and far higher than the high of $203 million on 28-Jun-2019, while 6.1.6. Client Gross IM required was $66.4 billion, up from $59.7 billion and the highest in our data
- BME – Power, 6.1.1 Total IM required was €295 million, up from €148 million
- CC&G – Equities, 4.4.3 Estimated largest stress loss (in excess of IM) from the default of any single participant, PeakDayAv, was €1.6 billion, almost double the €885 million in prior quarter
- CDCC – 6.5.4 Breaches of IM coverage, size of uncovered exposure, peak size, decreased to just C$0.5 million from C$364 million and C$1.5 billion before that
- CME – Base 16.1.1 Total cash (but not securities) received from participants for initial margin was $114 billion up from $102 billion, continuing it’s long running increasing trend from $25 billion in Jun-2018
- CME – IRS 16.1.1 Total cash (but not securities) received from participants for initial margin was $23 billion up from $18 billion, continuing it’s long running increasing trend from $9 billion in Jun-2018
- DTCC MBSD – 7.3.5 Estimated largest same-day payment obligation that would be caused by the default of any single participant in extreme but plausible conditions was $54 billion, up from $42 billion QoQ and up from $32 billion YoY
- Eurex Clearing – 6.2.10 Total IM PreHaircut held as Non-cash Equities was €1.7 billion up from €690 million QoQ and €360 million YoY
- ICE Clear Credit – 4.4.7 Estimated largest aggregate stress loss (in excess of IM) that would be caused by the default of any two participants in extreme but plausible conditions was $250 million, up from $190 million QoQ and $100 million YoY
- ICE Clear US F&O – 4.4.7 Estimated largest aggregate stress loss (in excess of IM) that would be caused by the default of any two participants in extreme but plausible conditions was $620 million, up from $460 million QoQ and $310 million YoY
- LCH SA – Cash and Derivatives 20.3.1 Initial margin or equivalent financial resources collected from each linked CCP to cover potential future exposure to the linked CCP on contracts cleared across the link was €3.2 billion up from €2.6 billion QoQ
- LME – 15.3.2 Percentage of total income that comes from the reinvestment of assets provided by clearing participants was 35.8%, up from 26.9% QoQ and 24.3% YoY, while 16.2.17 Estimate of the risk on the investment portfolio 99% 1d VaR was $138K, up from $30k QoQ and $58K YoY
- OCC – 4.1.1 Prefunded – Own Capital Before was $305 million, up from $255 million QoQ and $147 million YoY, 4.4.7 Estimated largest aggregate stress loss (in excess of IM) that would be caused by the default of any two participants in extreme but plausible conditions was $5.1 billion up from $4.4 billion, while 6.2.1 Total IM cash deposited deposited at central bank was $1.15 billion up from $485 million and $35 million before that
- ……
- ….. skipping S to T letters, o/w this is going to become a very long lists of bullet points
- ……
There are a lot more Disclosures and Clearing Services but I will stop there and leave it to those of you with your own CCPView access to analyze further changes.
More Disclosures
CCPView has disclosures from 42 Clearing Houses, each with many Clearing Services, covering Equities, Bonds, Futures, Options and OTC Derivatives with over 200 quantitative data fields each quarter and quarterly figures from September 2015 to June 2021; there is a lot of interesting data to analyze.
Please contact us if you are interested in subscribing to CCPView.