Clearing Houses have published their latest CPMI-IOSCO Quantitative Disclosures:
- Initial margin for IRS at $252 billion down 3% QoQ and 4% YoY
- Initial margin for CDS at $60 billion up 4% QoQ and down 3% YoY
- Initial margin for selected ETD at $470 billion up 6% QoQ and 13% YoY
- Initial margin increases at ICE Europe F&O, Eurex OTC IRS, ICE Credit Clear, JSCC IRS
- Explanatory Notes are now available in CCPView
- Other disclosures changing >10% highlighted below
Background
Under the CPMI-IOSCO Public Quantitative Disclosures, CCPs publish over two hundred quantitative data fields covering margin, default resources, credit risk, collateral, liquidity risk, back-testing and more.
CCPView has 6 years of these quarterly disclosures for 43 Clearing Houses, each with multiple Clearing Services, covering the period from 30 Sep 2015 to 30 Sep 2021. This disclosure data provides insights into trends over time at one CCP and comparisons between CCPs.
Initial Margin for IRS
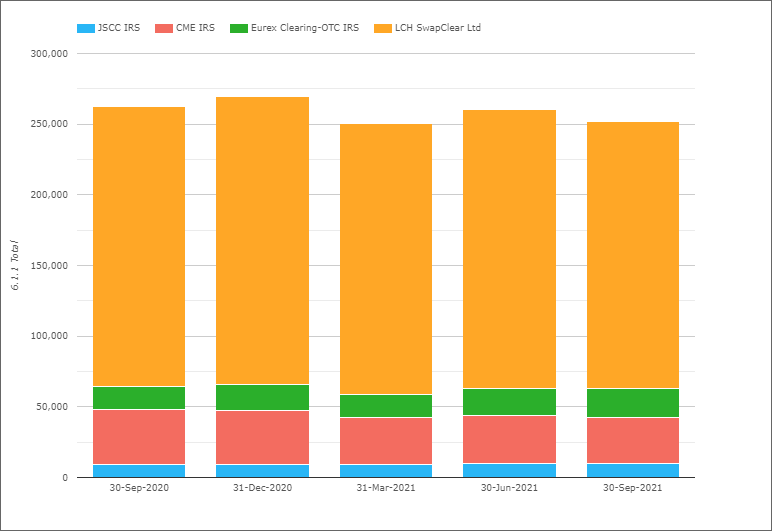
- Total IM for these four CCPs was $252 billion on 30-Sep-2021
- $8 billion or 3% lower than the quarter earlier
- $11 billion or 4% lower than a year earlier
- LCH SwapClear with $189 billion or £140 billion on 30-Sep-2021
- Is down 4.3% QoQ in USD terms or 1.3% in GBP terms
- While YoY, LCH SwapClear is down 4.7% in USD terms and 9% in GBP terms
- CME IRS with $32 billion, down 5.5% QoQ and down 17.8% YoY
- Eurex OTC IRS with $20.9 billion or €18 billion
- Up 9.8% QoQ in USD terms or 12.9% in EUR terms
- Up 27.7% YoY in USD terms or 29.2% in EUR terms
- JSCC IRS with $10 billion or Y1,135 billion
- Up 1.8% QoQ in USD terms or 3.2% in JPY terms
- Up 7.7% YoY in USD terms or 14.1% in JPY terms
IM for IRS staying in the $250-270 billion range for over a year now, seemingly a new plateau and a marked change from the QoQ and YoY increases in the three years from 2017-2019.
Eurex and JSCC both with QoQ and YoY increases in IM, while LCH and CME with decreases.
Initial Margin for CDS
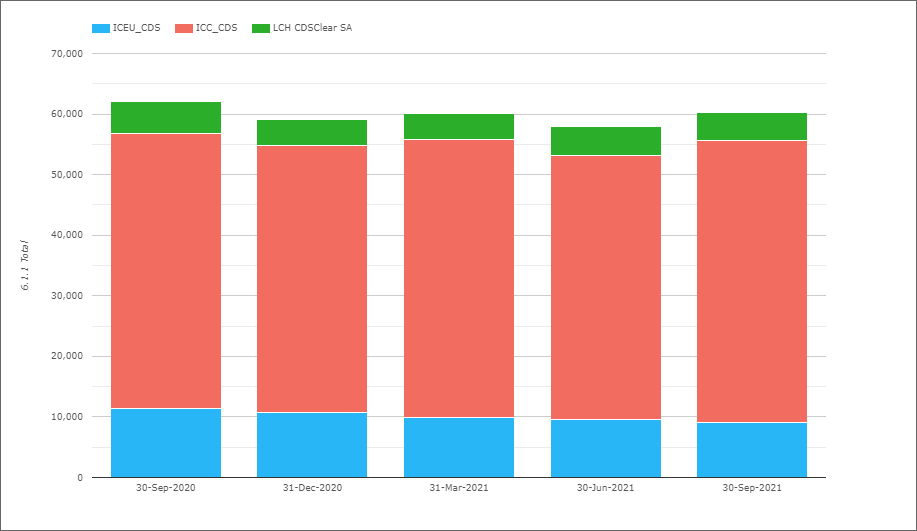
- Total IM for these three CCPs was $60 billion on 30-sep-2021
- Up 3.9% QoQ and down 3% YoY in usd terms
- ICE Credit Clear with $46.5 billion, up 6.5% QoQ and 2.2% YoY
- ICE Europe Credit with €7.9 billion, down 2% QoQ and 18.5% YoY.
- LCH CDSClear with €4 billion, down 1.2% QoQ and down 11% YoY.
Overall CDS IM up QoQ, with ICE Credit Clear responsible for this increase, while both ICE Europe Credit and LCH CDSClear are down QoQ and YoY.
Initial Margin for ETD
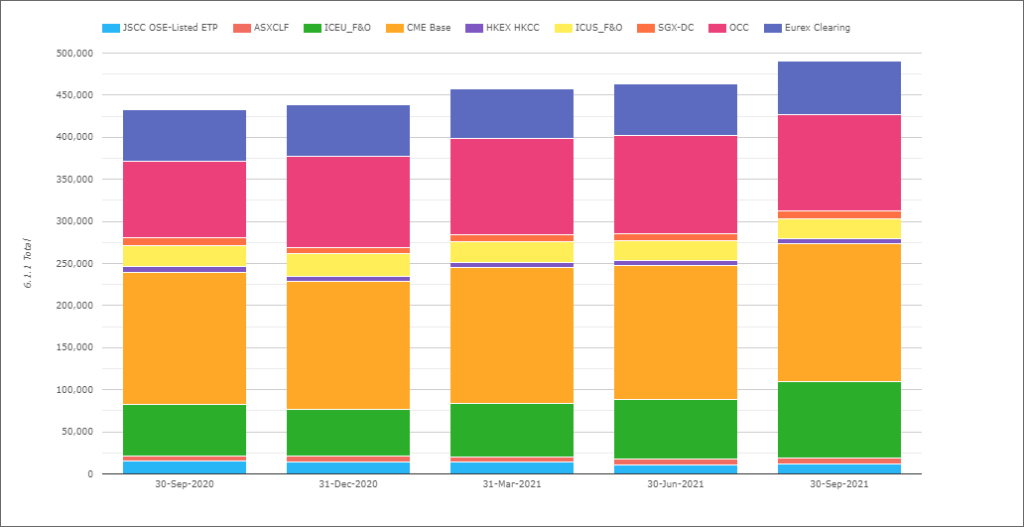
- Total IM for these CCPs was $470 billion on 30-Sep-2021
- Up $26b or 6% QoQ and up $54b or 13% YoY from 30-Sep-20
- (Note the chart shows slightly higher totals as the Eurex Clearing amount in the chart includes OTC IRS IM, which I exclude in my figures here)
- CME Base with $164 billion, up 2.6% QoQ and up 4.4% YoY.
- OCC with $115 billion, down 1.1% QoQ and up 25.6% YoY.
- ICE Europe F&O with $90.4 billion, up 28% QoQ and up 48% YoY.
- Eurex with $42.9 billion, up 1.8% QoQ and down 3.1% YoY.
- ICE US F&O $23.6 billion, flat QoQ and down 4.4% YoY.
- JSCC OSE Listed ETP with $12 billion, up 10.2% QoQ and down 19.4% YoY
- SGX-DC $8.9 billion, up 5% QoQ and down 6% YoY
- ASX CLF $6.8 billion, up 3.8% QoQ and flat YoY
- HKEX HKCC with $6.4 billion, up 18.5% QoQ and down 0.8% YoY
ETD IM rising QoQ by $26b and YoY by $54b, due mostly to the large increase of $20b QoQ and $29b YoY at ICE Clear Europe.
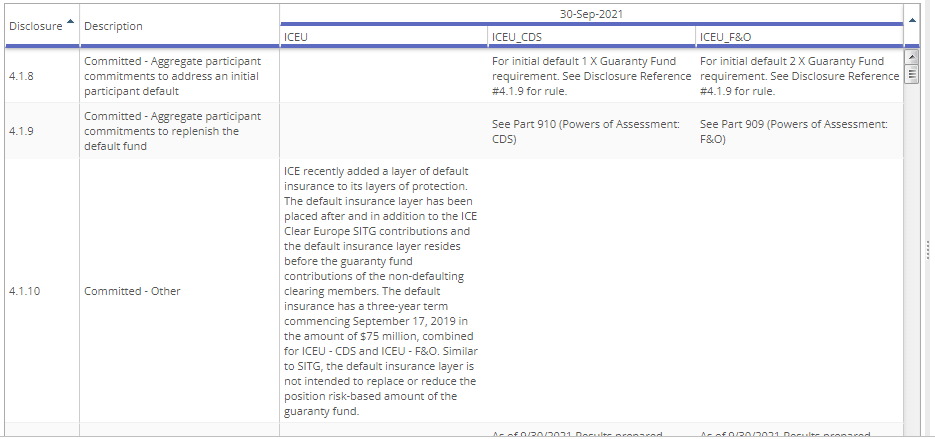
Explanatory Notes
A new feature we have recently added to CCPView is the ability to view any explanatory notes published by CCPs with their disclosures. Typically these can be in different documents, which we have now parsed and uploaded into our database. Users can now select the display type Notes and view these, as shown below for ICE Clear Europe for 4.1 Default Resources on 30-Sep-21.
Other Disclosures of Interest
Next let’s do a quick scan of 30-Sep-2021 disclosures highlighting a few with a change tolerance >10% outside the 3 year range of values:
- ASXCLF – 4.3.1 Cash deposited at central bank of issue was A$369 million versus A$253 million and A$165 million in the prior quarters and amounts below A$10 million for all prior quarters
- B3 – 16.2.1 Percentage of total participant cash held as cash deposits was 22.75%, up from 18.5%,14.1% and 14.3% in prior quarters.
- BME – Power, 6.1.1 Total IM required was €620 million, up from €295 million and €148 million in prior quarters
- CC&G – Bond, 4.4.3 Estimated largest stress loss (in excess of IM) from the default of any single participant, PeakDayAv was €2 billion down from €3.685 billion in th prior quarter
- CDCC – 4.1.4 Prefunded – Aggregate Participant Contributions – Required was C$3.5 billion up from C$3 billion in the prior quarter
- CME – 6.8.1 Maximum aggregate initial margin call on any given day was $2.7 billion up from $1.8 billion in the prior
- DTCC MBSD – 4.4.7 Estimated largest stress loss (in excess of IM) from the default of any two participants, PeakDayAv was $7.6 billion up from $6.6 billion in the prior quarter
- Eurex Clearing – 6.2.5 Total IM PreHaircut held as Non-cash Sovereign Gov Bonds – Domestic was €4.4 billion up from €3.8 billion QoQ and €3.4 billion YoY
- ICE Clear Credit – 4.3.1 Cash deposited at a central bank of issue of the currency concerned was $2.6 billion up from $1.9 billion in the prior quarter
- ICE Clear Europe F&O – 6.6.1 Average Total VM paid to the CCP by participants was $2.4 billion, up from $1.5 billion in the prior quarter
- ICE Clear US F&O – 4.4.3 Estimated largest aggregate stress loss (in excess of IM) that would be caused by the default of any single participant in extreme but plausible conditions, PeakDayAv was $480 million, up from $411 million QoQ and $350 million YoY
- LCH ForexClear – 6.1.1 Total IM required was $7.5 billion up from $6.7 billion in the prior quarter
- LME – 5.3.4 Number of days during the look-back period on which the fall in value during the assumed holding period exceeded the haircut on an asset was 36, up from 27 QoQ, 24 YoY and 11 on 30-Sep-19
- OCC –.4.3 Estimated largest aggregate stress loss (in excess of IM) that would be caused by the default of any single participant in extreme but plausible conditions, PeakDayAv was $5.9 billion, up from the $4 billion to $4.7 billion range it has been in
- ……
- ….. skipping the remaining, o/w this is going to become a very long lists of bullet points
- ……
There are a lot more Disclosures and Clearing Services but I will stop there and leave it to those of you with your own CCPView access to analyze further changes.
More Disclosures
CCPView has disclosures from 43 Clearing Houses, each with many Clearing Services, covering Equities, Bonds, Futures, Options and OTC Derivatives with over 200 quantitative data fields each quarter and quarterly figures from September 2015 to September 2021; there is a lot of interesting data to analyze.
Please contact us if you are interested in subscribing to CCPView.