The ISDA-Clarus RFR Adoption Indicator was published last week, covering December 2021. December saw some notable (!) events, including:
- Conversion of GBP, JPY and CHF positions into RFRs at major CCPs.
- Cessation of LIBOR in those three currencies (at the very end of our sample period).
- Activation of ISDA Fallbacks for any bilateral positions outstanding in these 3 currencies.
- Continuation of SOFR First in non-linear derivatives.
- Adoption of best principles for exchange traded derivatives in USD.
- The beginning of USD LIBOR cessation, with broad restrictions on the use of USD LIBOR in new derivatives contracts from a number of regulators.
Let’s take a look at the data for December, and what has happened so far this year in SOFR trading.
ISDA-Clarus RFR Adoption Indicator December 2021
Closing out 2021 with the following headlines:
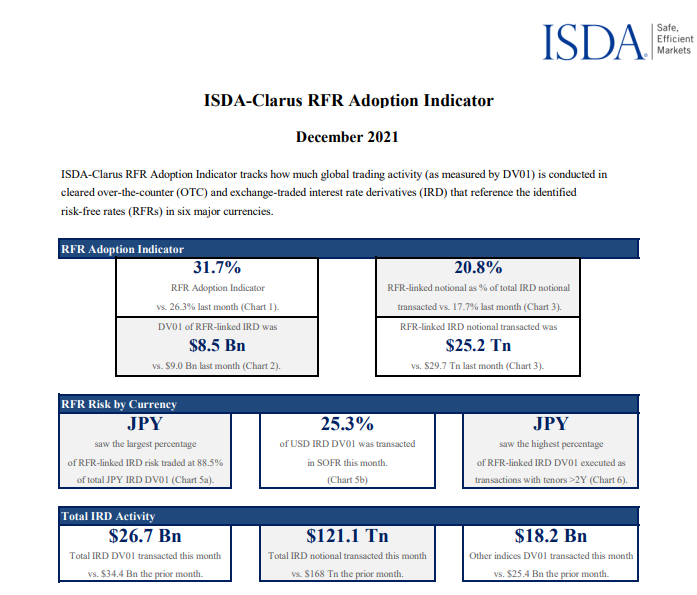
The ISDA-Clarus RFR Adoption Indicator stood at a new all-time high of 31.7% at the end of 2021:
Showing;
- 31.7% of all cleared derivatives risk was versus an RFR, a new all time high.
- SOFR adoption hit a new high of 25.3%.
- 83% of GBP risk was versus SONIA (a new high).
- 89% of JPY risk was versus TONA (a record for any RFR!).
- 79% of CHF risk was versus SARON (also a new high).
- €STR risk is continuing apace, reaching 16% of the EUR market.
Writing this in mid January, we now see three stories establishing themselves across the different markets:
- LIBOR is no longer published in GBP, JPY and CHF. It will therefore be interesting to see the January figures and how close to 100% we may get in each of these three currencies. What portion of the market will JPY TIBOR, for example, contribute to? Will there be any room for term rates in the others? Which currency will hit 100% first?
- For USD, the story is very much “live”. With most regulators putting in place broad restrictions on the use of USD LIBOR, how quickly can USD markets catch up?
- For EUR, will €STR adoption continue in a market-led move? (You could add AUD, CAD and other markets into this mix as well).
USD SOFR Adoption – a deep dive
This blog will focus on number 2 above, SOFR adoption. It is very likely to be a strong theme throughout the year, with several different strands. Let’s look at the data.
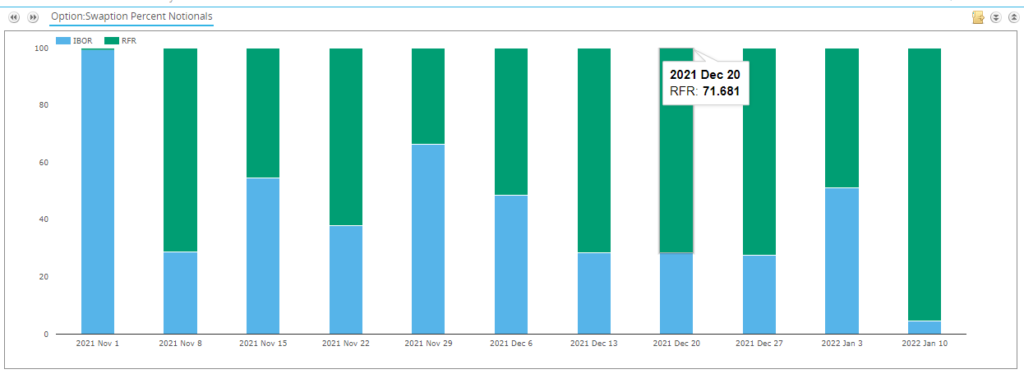
1. SOFR Swaption Adoption is soaring
First up, we need to update our readers on how successful SOFR First in Swaption markets has turned out to be. We saw 95% of USD swaptions (on SEF) last week traded versus SOFR!
Please note:
- All Swaptions executed on-SEF were done on D2D SEFs. I don’t see any recently executed SOFR swaptions on Tradeweb or Bloomberg D2C SEFs. Do they even offer them yet?
- However, even looking at off-SEF volumes, a huge 88% of volumes are also versus SOFR. This is even more surprising when we consider that the highest number of off-SEF swaption trades were reported last week since SOFR First in Swaptions began.
- The USD LIBOR swaption market really seems to have been marginalised last week.
- Will this continue as Rates continue higher? Are we about to see another bout of convexity hedging? Will all of this be done in SOFR space? Interesting times ahead….
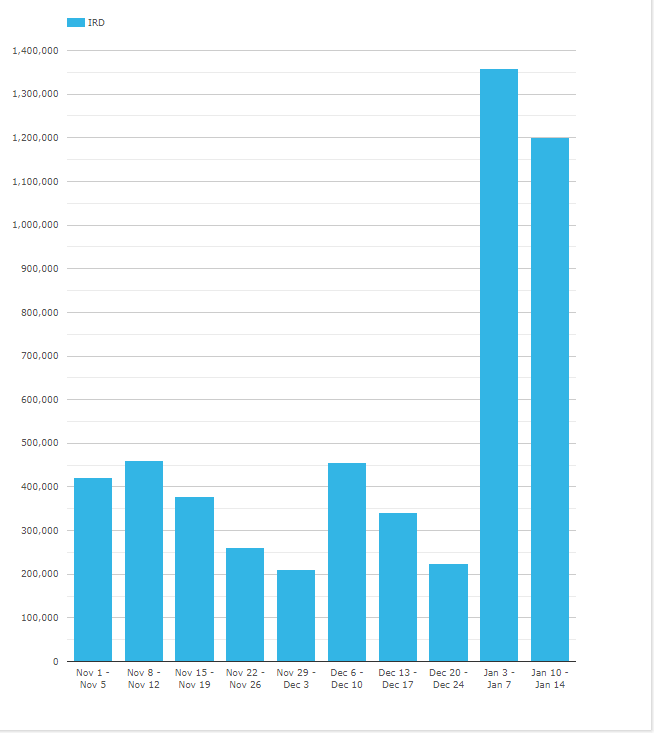
2. USD LIBOR is Still Trading
On the face of it, our data shows that USD LIBOR is continuing to trade, with over $1.8Trn equivalent traded each week so far in 2022 (!):
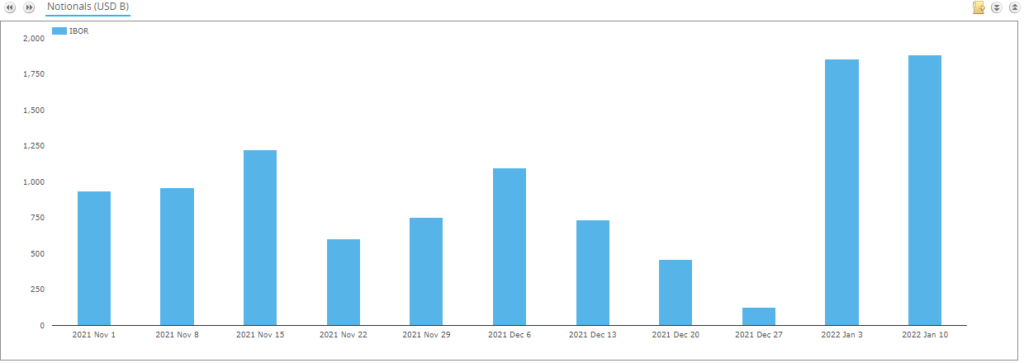
However, this is a really misleading chart!
Why? Answer: FRAs and Single Period Swaps.
As we looked at for GBP markets, Fixed Float IRS volumes are now inflated by the inclusion of Single Period Swaps (SPS). These products offer a similar pay-off to FRAs, but the payment happens at the end of the period rather than the beginning (and the discounting is different). The key fact here is that SPS are compatible with ISDA Fallbacks, whilst FRAs are not.
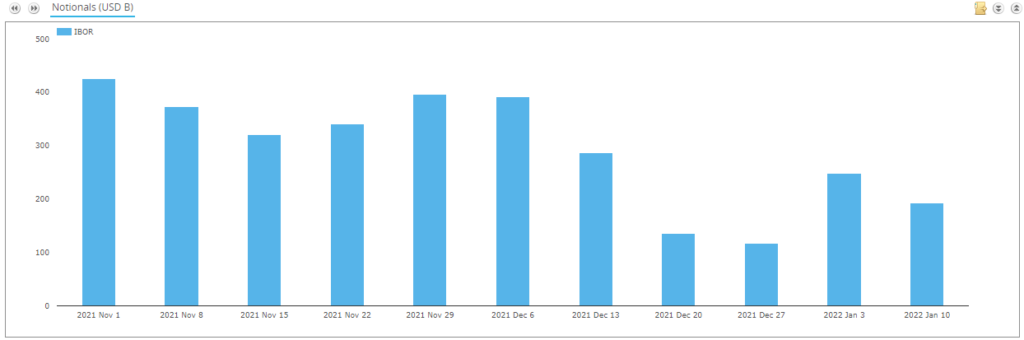
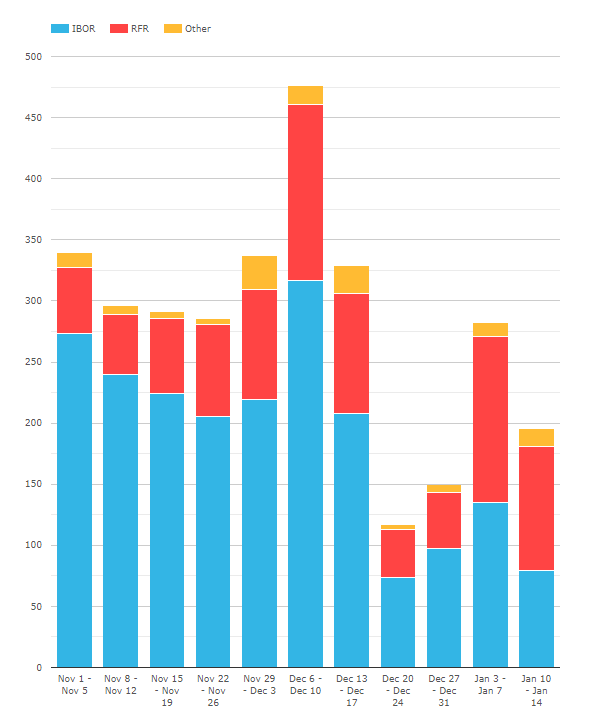
If we exclude SPS from USD LIBOR volumes in 2022:
Showing:
- SPS accounted for $1.7Trn of notional each week in 2022!
- That reduces weekly USD LIBOR volumes to around $200bn – much better, but still a significant volume.
- How significant? By DV01, they accounted for approximately 26% of the market (excluding SPS!):
SEFView shows that most of the SPS were executed on NEX SEF. This is a good thing for LIBOR transition remember. Even though they show up as new volumes, these volume matching exercises are inherently risk reducing for the dealer portfolios submitted to the Reset runs.
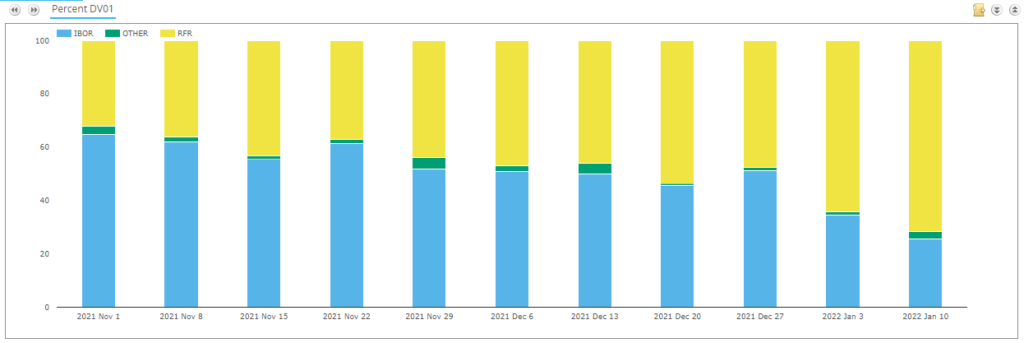
Dealer to Client Markets
Looking at USD activity on Bloomberg and Tradeweb SEF’s allows us an insight into how much SOFR activity is occurring in D2C markets. The data is interesting. It is REALLY IMPORTANT to run this in DV01, otherwise a lot of short-dated activity will skew the data:
Showing;
- LIBOR dropped to 41% of total trading on D2C SEFs for USD IRD products last week. (This is just 17% when measured by notional, but that includes a large amount of Fed Funds activity).
- TW saw a huge notional amount of Fed Funds activity, but that was all very short-dated. On a DV01 basis, these “other” indices accounted for just 7% of activity.
- SOFR adoption was up last week to hit a new record of 52% of activity, up from 48% in the prior week.
For comparison, about 70% of total risk is traded versus SOFR in the D2D market at the moment.
Term Indices in USD
Finally for this rundown on USD markets, it is notable that there has been some real activity in Term Rates – namely Bloomberg’s BSBY fixing:
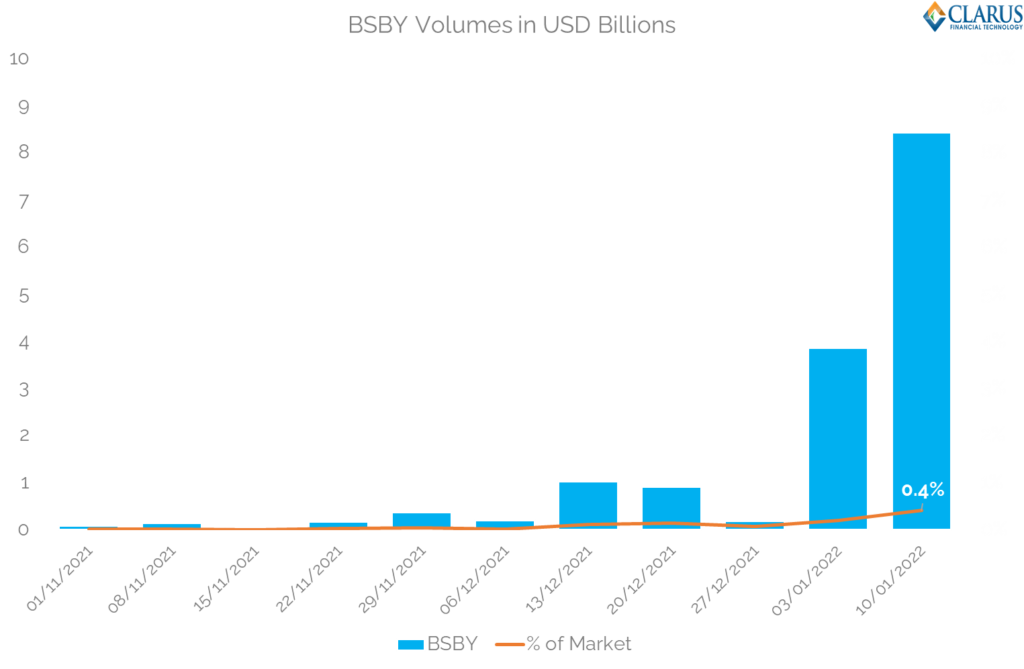
Showing;
- Over $8bn of notional tied to BSBY traded last week.
- These trades covered maturities from very short (3M) all the way out to 12Y swaps.
- Obviously, most of the notional is at the short end of the curve.
- Don’t get too carried away – BSBY notional still only accounted for 0.4% of all Fixed Float USD swaps reported to SDRs last week! It would be even lower if SOFR swaps were also included (dropping to about 0.2%).
Still, it is interesting to see activity in this new index and that trades have extended so far out the curve already. One to watch.
In Summary
- RFR Adoption has hit a new all time high of 31.7% across all markets.
- USD SOFR adoption is being closely monitored, now accounting for 25% of the total market and up to 70% in D2D OTC markets.
- USD Swaptions are now predominantly trading versus SOFR, accounting for up to 95% of volumes.
- D2C markets in USD rates see about 50% of total OTC volumes (IRS, OIS) executed versus SOFR. This is lower than in D2D markets.
- New USD term rates, such as BSBY, have seen an increase in activity so far in 2022.