Clearing Houses have published their latest CPMI-IOSCO Quantitative Disclosures:
- Initial margin for ETD at $465 billion is up 6% QoQ and down 6% YoY
- Initial margin for IRS at $331 billion is up 17% QoQ and up 6% YoY
- Initial margin for CDS at $60 billion is down 4% QoQ and down 13% YoY
- In 4Q23 a number of CCP quantitative disclosure show record highs
- Highlighted are B3, CC&G, CCIL, CME, DTCC, Eurex, LCH
- Charts and details below
Background
Under the CPMI-IOSCO Public Quantitative Disclosures, CCPs publish over two hundred quantitative data fields covering margin, default resources, credit risk, collateral, liquidity risk, back-testing and more.
CCPView has over 8 years of these quarterly disclosures for 44 Clearing Houses, each with multiple Clearing Services, covering the period from 30 Sep 2015 to 31 Dec 2023. This disclosure data provides insights into trends over time at one CCP and comparisons between CCPs.
Let’s take a look at the latest disclosures.
Initial Margin for IRS
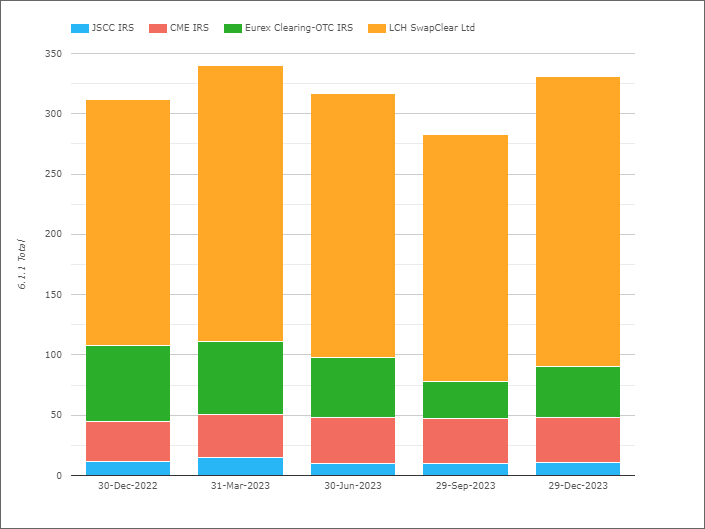
- Total IM at these four CCPs was $331 billion on 29-Dec-2023
- Up $48 billion or 17% QoQ and up $19 billion or 6% YoY
- LCH SwapClear with $241 billion or £167 billion on 29-Dec-2023
- Up 13% QoQ and 12% YoY in GBP terms (Up 18% QoQ & YoY in USD terms)
- Eurex OTC IRS with $41.7 billion or €37.65 billion
- Up €8.75 billion or 30% QoQ and down €22 billion or 37% YoY (in EUR terms)
- CME IRS with $37.4 billion, flat QoQ and Up 14% YoY
- JSCC IRS with $11.2 billion or Y1,585 billion, up 4% QoQ and up 2% YoY (in JPY terms).
Total IM for IRS at $331 billion in the latest quarter is close to the record high of $339 billion on 31-Mar-2023.
Initial Margin for CDS
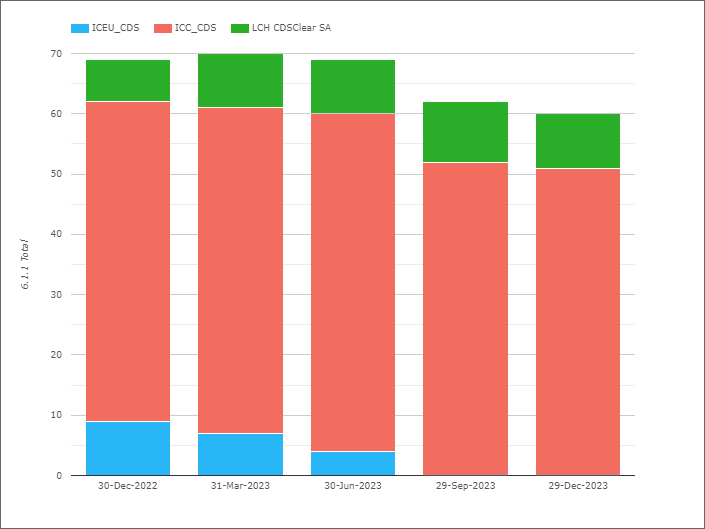
- Total IM at these three CCPs was $60 billion on 29-Dec-2023
- Down $2.7 billion or 4% QoQ and down $9 billion or 13% YoY
- ICE Credit Clear with $51 billion
- Down $1.3 billion or 2.5% QoQ and down $2.4 billion or 4.5% YoY
- LCH CDSClear with €8 billion
- Down €1.4 billion or -15% QoQ and dp €1.9 billion or 31% YoY
- ICE Europe Credit with nothing, down from €200 million on 29-Sep-2023
With ICE Europe Credit now shut down, there are greater netting benefits for member and client accounts at 2 CCPs as opposed to 3, which goes some way to explaining the lower level of CDS IM at $60 billion from the $69 billion a year earlier.
Initial Margin for ETD
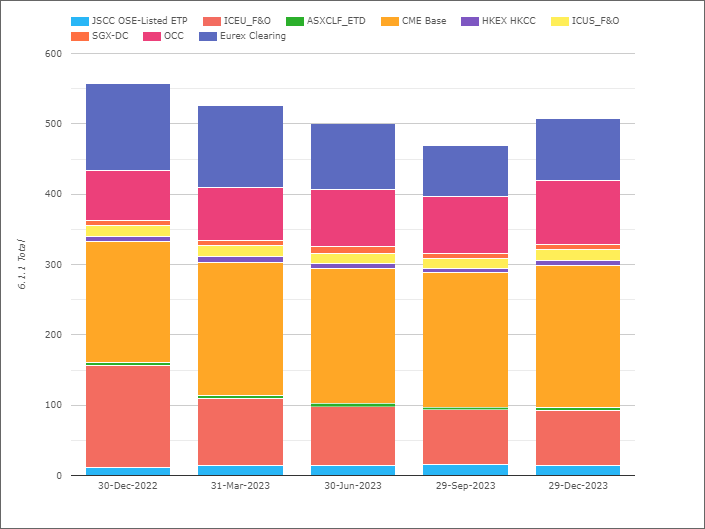
- Total IM for these CCPs was $465 billion on 29-Dec-2023
- Up $27b or 6% QoQ and down $29b or 6% YoY
- (Note the chart shows higher totals as Eurex includes OTC IRS IM, which I exclude)
- CME Base with $203 billion, up 6% QoQ and up 17% ($30b) YoY.
- ICE Europe F&O with $78 billion, flat QoQ and down 46% ($67b) YoY
- OCC with $90.5 billion, up 12.5% QoQ and up 30% ($21.b) YoY.
- Eurex with $45 billion, up 8% QoQ and down 27% ($17b) YoY.
- ICE US F&O $15.85 billion, up 16.5% QoQ and 2% YoY.
- JSCC OSE Listed ETP with $14 billion, down 10% QoQ and up 32% YoY
- SGX-DC $8 billion, up 5% QoQ and up 9% YoY
- HKEX HKCC with $6.3 billion, flat QoQ and down 15% YoY
- ASX CLF ETD $3.7 billion, up 11% QoQ and down 6% YoY
IM at all CCPs of $465 billion is back to the level on 30-Jun-23, with CME Base, OCC, Eurex and ICE US F&O all up in the quarter.
Other Disclosures of Interest
Next let’s do a quick scan of 29-Dec-23 disclosures, highlighting those with significant changes.
- B3 (Brasil Bolsa Balcao) – 4.1.1 Prefunded – Own Capital Before was $298 million, up from $148 million, a new record high, while 4.1.4 Prefunded – Aggregate Participants Contributions was $413 million, up from $342 million, also a new high
- B3 – 4.4.3 Estimated largest aggregate stress loss (in excess of IM) that would be caused by the default of any single participant in extreme but plausible market conditions, PeakDayAmount was $587 million, up from $475 million, also a new high
- B3– 6.1.1. Total initial margin required was $92.9 billion, up from $83 billion, a record high
- CC&G Equities – 18.2.3 Percentage of open positions held by the largest 10 clearing members, PeakInQuarter was 80%, up from 71%, a new high and significantly up from 64% on 31-Mar-23
- CCIL (Clearing Corporation of India) Forex – 4.4.8 Number of days on which the estimated largest stress loss (in excess of IM) that would be caused by the default of any two participants exceeded actual pre-funded default resources was 9, up from 5, while the prior high was 8 in the 30-Jun-2023 quarter
- CME Base – 6.2.5 Total IM PreHairCut Non-Cash Sovereign Government Bonds – Domestic was $124 billion, up from $112 billion and a record high
- DTCC GSD – 4.1.5 Prefunded Aggregate Participants Contributions – Post-haircut Posted was $56.5 billion, up from $49.4 billion and the highest on record
- DTCC GSD – 6.6.1 Average Total VM paid to the CCP was $8.7 billion, up from $7.1 billion, a new high
- DTCC GSD – 6.7.1 Maximum Total VM paid to the CCP on any day in the period was $15.6 billion, up from $9.5 billion, with the prior high being $12 billion in the quarter ending 31-March-2020 (Covid quarter)
- Eurex Clearing – 4.4.3 Estimated largest aggregate stress loss (in excess of IM) that would be caused by the default of any single participant in extreme but plausible market conditions, MeanAverageAmount was $3.1 billion, up from $2.6 billion, a new high
- LCH SwapClear– 6.1.1 Client Net IM required jumped to $23.9 billion from $13.6 billion in the prior quarter, a new record high
- LCH ForexClear – 19.1.1 Number of Clients increased to 77 from 67 in the prior quarter, while 19.1.2 Number of Direct Members that clear for clients was 22 up from 21
- ….. we could go on and on …..
There are a lot more Clearing Services and Disclosures but I will stop there and leave it to those of you with your own CCPView access to analyze further changes.
As well as a Web UI, we also offer an API to programatically access this data.
IOSCO Quantitative Disclosures
CCPView has disclosures from 44 Clearing Houses, each with many Clearing Services, covering Equities, Bonds, Futures, Options and OTC Derivatives with over 200 quantitative data fields each quarter and quarterly figures from September 2015 to December 2023.
If you are interested in this data, please get in touch.