- 8 out of the 10 largest ever months in Cable basis swaps have occurred in the past 15 months.
- We use SDRView to look at the data in this uncleared market.
- Our ticker view shows a persistent move higher in cross-currency basis over the past nine months.
Issuance
A particular headline in the FT recently piqued the interest of this blogger:

Like a moth to a flame, I was drawn to the statement:
The demand has helped push a number of continental European companies to issue sterling debt for the first time in recent months, including German real estate company Vonovia, German truck manufacturer Traton and French luxury goods group Kering.
FT.com: Pension fund demand drives resurgence of UK corporate bond market
Great, I thought, let’s go look at the data in GBPUSD (Cable) Cross Currency Swaps. Why?
- European issuers of GBP-denominated debt are receivers of GBPUSD XCCY basis – they receive the GBP cashflows from a bank counterparty on a XCCY swap and pass them on to the bondholders. In exchange, they pay the bank counterparty a series of EUR cashflows on the XCCY swap.
- UK-based pension funds buying EUR-denominated corporate debt and creating a synthetic GBP bond are also receivers of GBPUSD XCCY basis – they receive GBP cashflows from their bank counterparty, in exchange for paying the bank the EUR-denominated cashflows on the bond they are holding.
What a 12 months in Cable
SDRView data reveals a whole lot of volume records in the past 12 months for cross currency swaps.
In Notional terms, GBPUSD volumes were impressive in January 2024 at $127bn, the third largest month ever on record. Even more impressive is the recent history:
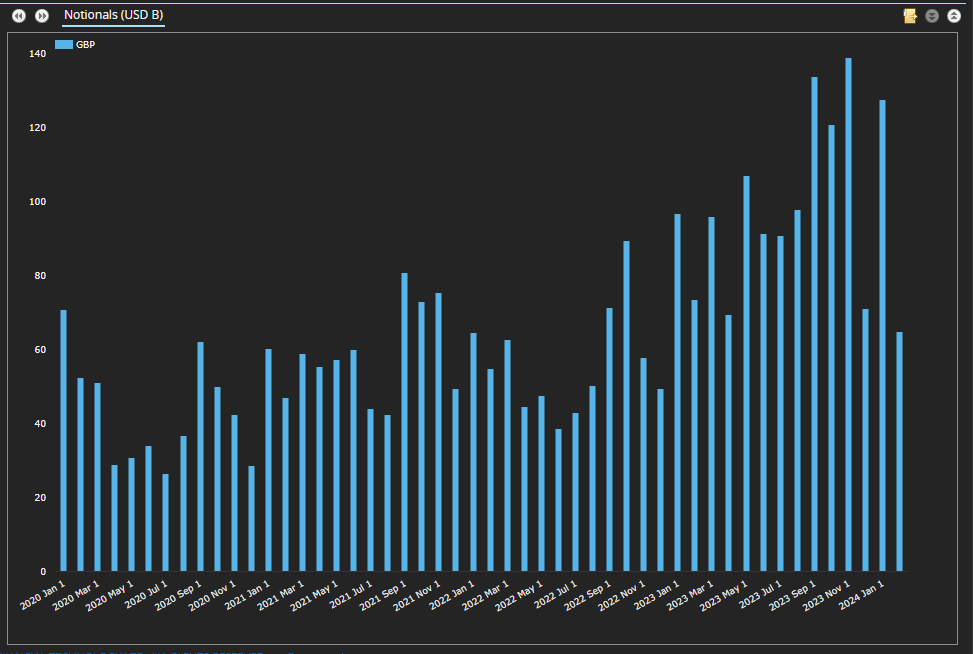
- This volume chart is quite incredible.
- 8 out of the 10 largest volume months in GBPUSD have occurred in 2023/24.
- Not shown on the chart, June 2018 creeps in as the 9th largest month whilst October 2022 is the 10th (in GBP terms, with it equal to the 11th largest if measured in USD).
- Wow….that is some run for Cable volumes.
These record figures represent about 1,000 trades per month. Of these only 10-30 have been large enough to go over the capped threshold. As such, these volumes are a good reflection of the volumes traded in interdealer markets involving US persons.
On an annual basis, GBPUSD saw 2023 notional volumes 72% larger than 2022 (in GBP terms), and the largest since 2018.
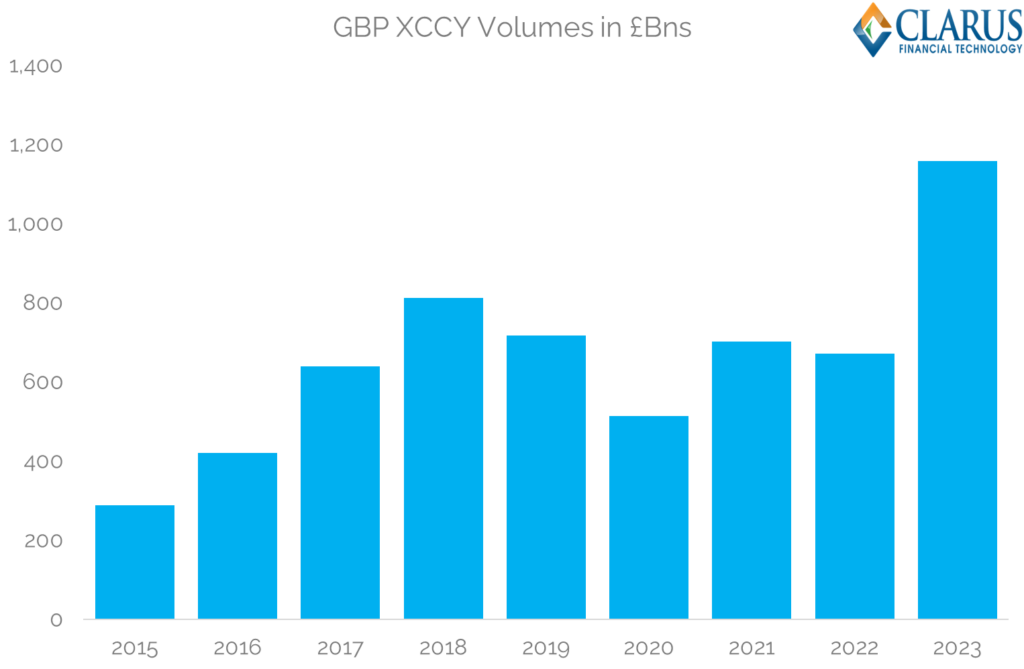
As I highlighted in an earlier blog, DV01 volumes were “only” up by 37% between 2022 and 2023, suggesting a trend toward shorter and larger notional trades.
SEFs
This huge increase in volumes has coincided with fewer trades being reported on-SEF. By trade count, we are down to around 15% in the past 12 months, from 25%+ previously – it is an interesting chart:
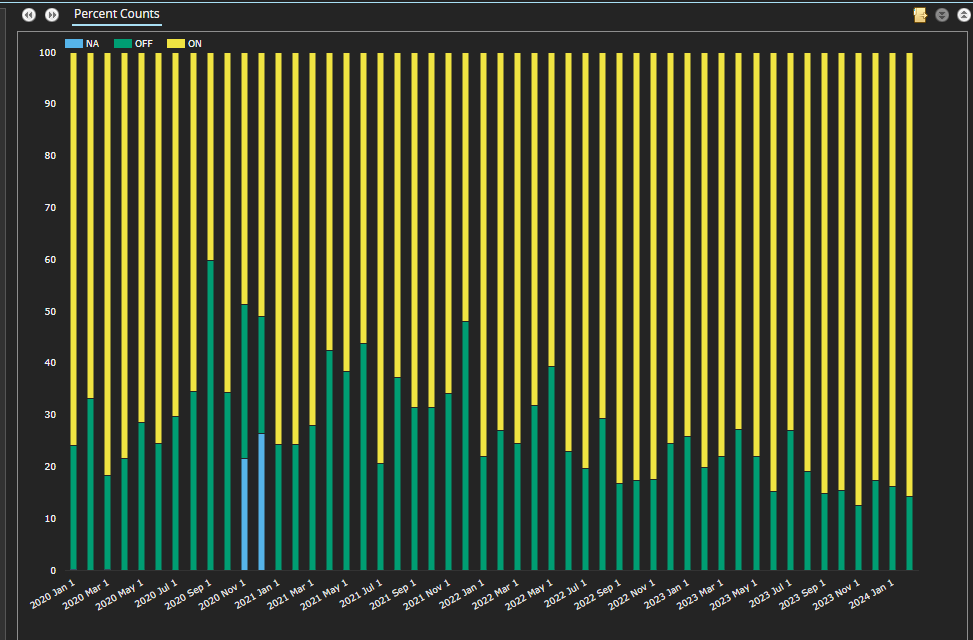
- There could be a number of reasons for this reduction in SEF usage.
- Remember that almost all of these trades will be voiced-brokered in the IDB market. With little to no workflow benefits (and no execution mandate), will traders choose to send these trades to a SEF?
- Equally, we could be seeing fewer entities sending trades to a SEF – e.g. are there Brexit entities active in this market who are choosing not to send their trades to a SEF (for reasons of onboarding maybe?).
- It could also be due to the rise of a new market participant?
- It would be an interesting one to unpick…..
Hand on heart, I expected this to be the least interesting chart today, but as we so frequently discover, every bit of data paints a picture!
Price Data
The FT commentary focuses on the receive/sell-side of the GBPUSD story:
- European issuers of GBP-denominated debt are receivers of GBPUSD XCCY basis – hence putting downward pressure on prices.
- UK-based pension funds buying EUR-denominated corporate debt and creating a synthetic GBP bond are also receivers of GBPUSD XCCY basis.
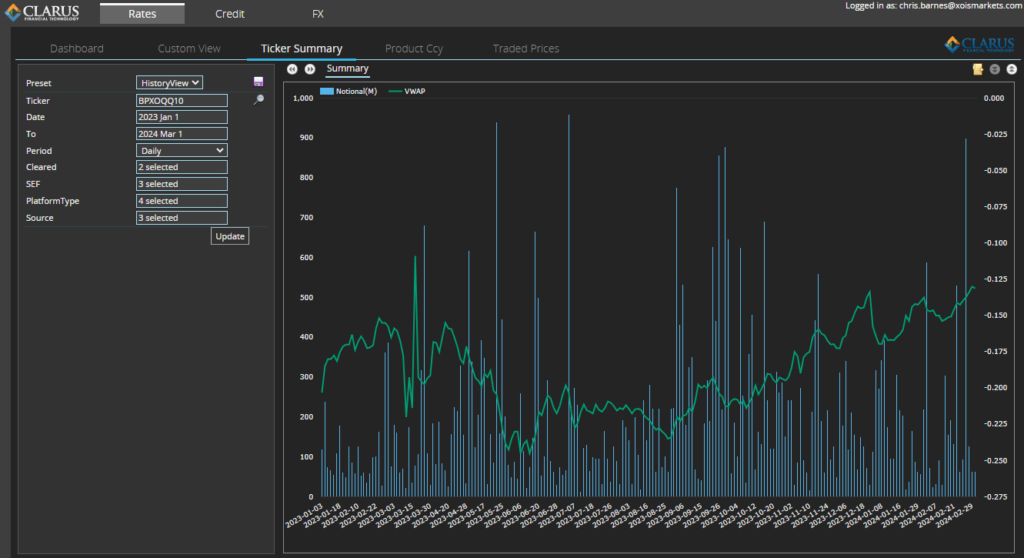
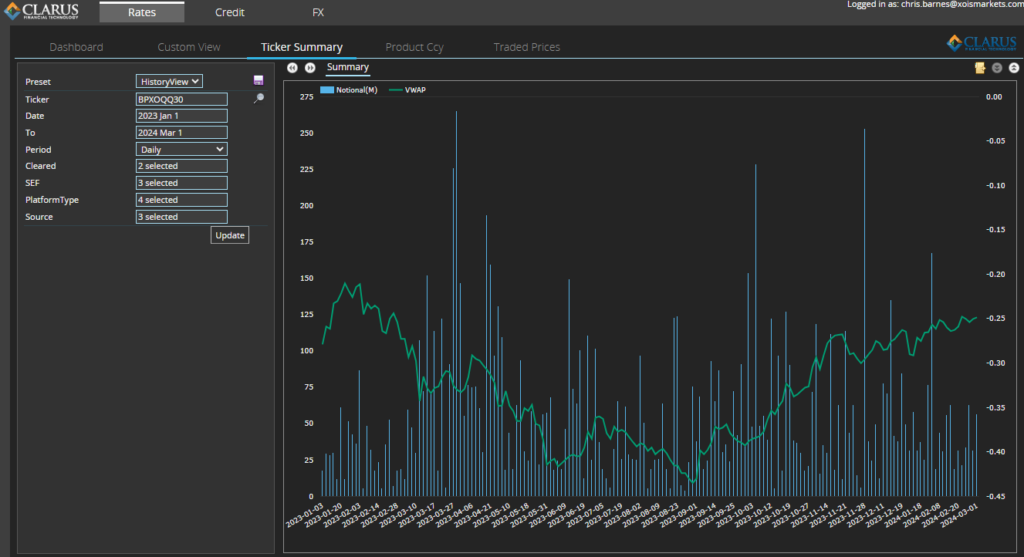
However, the charts suggest that issuers have actually been attracted into issuing GBP bonds due to the rising levels of GBPUSD basis since the middle of 2023. This can be seen across the Cable curve. Our ticker view shows this nicely for each of the benchmark maturities:
GBPUSD5Y (Sonia vs SOFR):
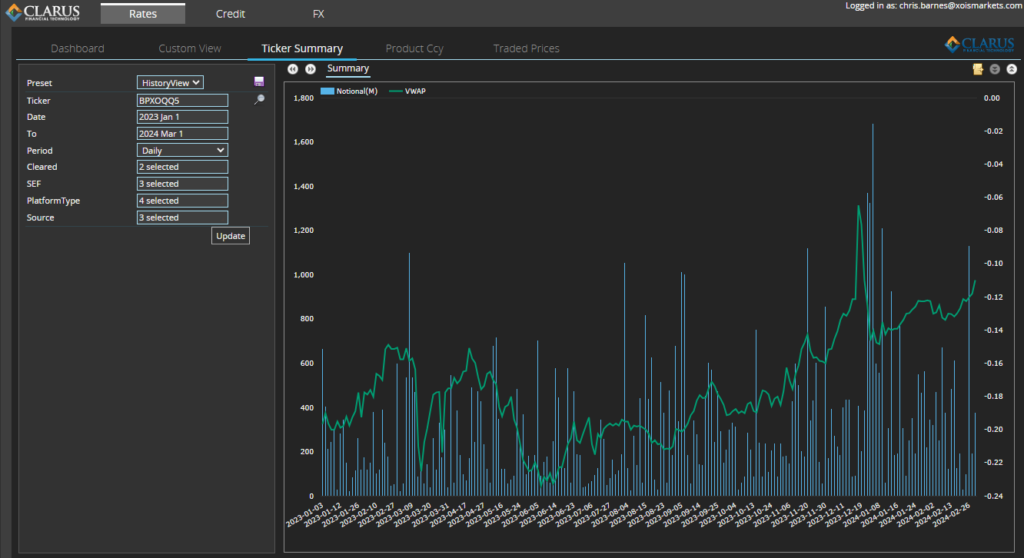
GBPUSD10Y (Sonia vs SOFR):
GBPUSD30Y (Sonia vs SOFR):
Market participants will be aware that this isn’t necessarily a unique-to-Cable story. The rise in EURUSD basis made it FTAlphaville’s lead chart in their “Chartmas” quiz:
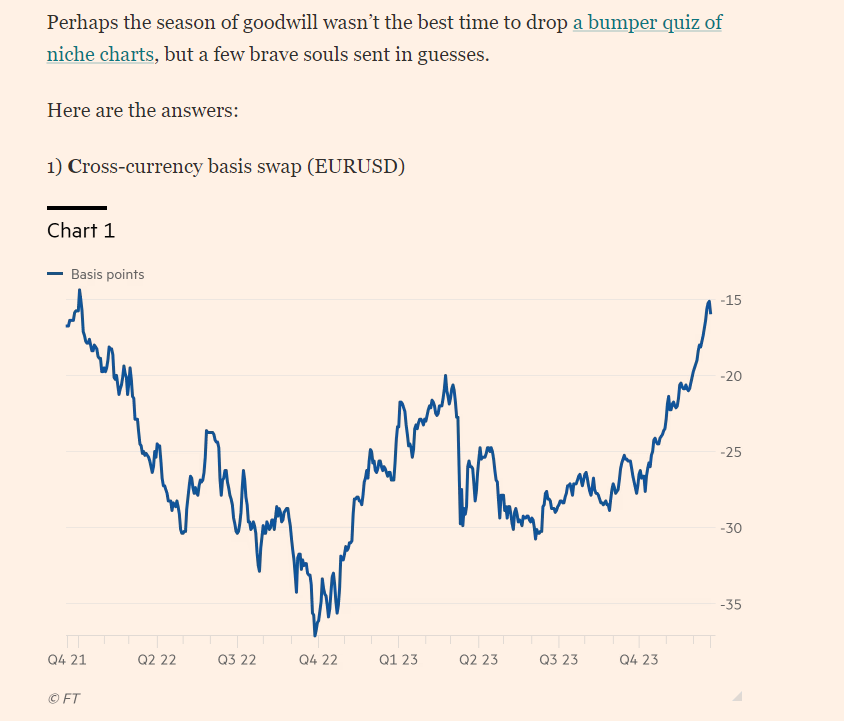
I won’t embarrass myself and suggest reasons behind the persistent “bid-for-basis” across both GBPUSD and EURUSD. I will note, however, that this has been one hell of a trend for almost nine months, and could be considered stretching all the way back to Q4 ’22 if it weren’t for that pesky “bank run” period in March 2023.
Cable basis was dragged hugely lower during the Gilt Crisis in Q4 ’22, with the recent run higher returning us to 2021 levels. Needless to say, the charts above are SONIA vs SOFR (RFR vs RFR), as opposed to credit-linked LIBOR vs LIBOR measures.
In Summary
- Cross border issuance made it into the main-stream press recently, igniting our interest in SDR data for Cross Currency Swaps.
- 8 out of the 10 largest volume months occurred in 2023 and 2024 in Cable basis swaps.
- This is against a backdrop of a persistent “bid-for-basis” in both EURUSD and GBPUSD markets.
- The proportion of the market trading on-SEF has reduced recently in GBPUSD.