- JSCC has enjoyed a 63% market share in vanilla JPY IRS versus LCH over the past year.
- The market shares vary by tenor and month-by-month.
- JPY OIS trading is a very small market. LCH is the leading CCP in this market with a 67% market share.
- JPY single currency basis trading remains a large market and JSCC have a 70% market share.
- The JSCC-LCH price basis has tightened significantly in recent times. Does this change market share in the future?
For a few reasons, I’ve been looking into JPY IRS markets this past week. Below I share some of my findings.
CCP Market Share
Amir reported in his Q3 2018 Global Swaps Volume review that JSCC have a 55% market share and LCH enjoy a 45% market share in JPY swaps across all products – that is to say IRS, OIS and single currency Basis (plus some small volumes in VNS and ZC swaps).
I wanted to drill-down into these figures so that I could get a better understanding of what is trading and where.
This is particularly interesting for LCH and JSCC because we have tenor data for both CCPs in CCPView. So I can look at IRS (and OIS,Basis etc) to see trading volumes by tenor and hence DV01 (risk traded).
Market Share in 2 Year Swaps
Let’s start with the short stuff – 2 year tenors and below. These volumes could be impacted by FRA volume matching services, such as NEX’s Reset. These services provide important risk management to clean up swap portfolios. However, due to historic reasons, all JPY FRAs that are transacted are booked as single period swaps (with payment at the end of the period instead of at the beginning as for FRAs). Whilst this means that we cannot directly see where NEX send their FRAs for clearing, we can check the market share of LCH and JSCC in tenors of 2 year and less for IRS:
 Showing;
- For the past year, the market share has been pretty much 50/50 in short-dated products.
- This suggests that FRA matching services send volumes to both LCH and JSCC. I was surprised by this – normally I would think that the risk is short enough for there to be no intrinsic pricing differential arising from margin costs, and hence that it makes most sense to concentrate all of the liquidity for FRA matching runs into a single CCP.
- I guess there is always the portfolio argument to overlay this – if you have 50% of your positions at two CCPs, you may as well try to neutralise as much of your FRA risk at each CCP as possible, which should have the added benefit of reducing your IM at each CCP too.
Market Share in Longer Tenors
What is particularly valuable about the transparency in CCPView is the ability to look at a CCP’s business by tenor. This means that we can look at their market share in by tenor and subsequently by DV01 (i.e. the amount of risk actually traded).
First, as measured by notional for IRS tenors longer than 2 years:
Showing;
- JSCC have a clear lead in terms of market share. (JSCC in blue on the chart above).
- Over the past year, JSCC have enjoyed a 63% market share in vanilla IRS JPY trading compared to LCH at 37%.
- Overall volumes in JPY swaps have been impressive – regularly topping $750bn equivalent. Volumes have been pretty consistent, barring a notable drop in June 2018.
Market Share by DV01
What do the charts look like if we translate them to DV01 terms? I wouldn’t expect too much difference as when I look at the individual tenor buckets, it tends to be pretty consistent 60/40 split between the two. Let’s run the numbers anyway:
 Showing;
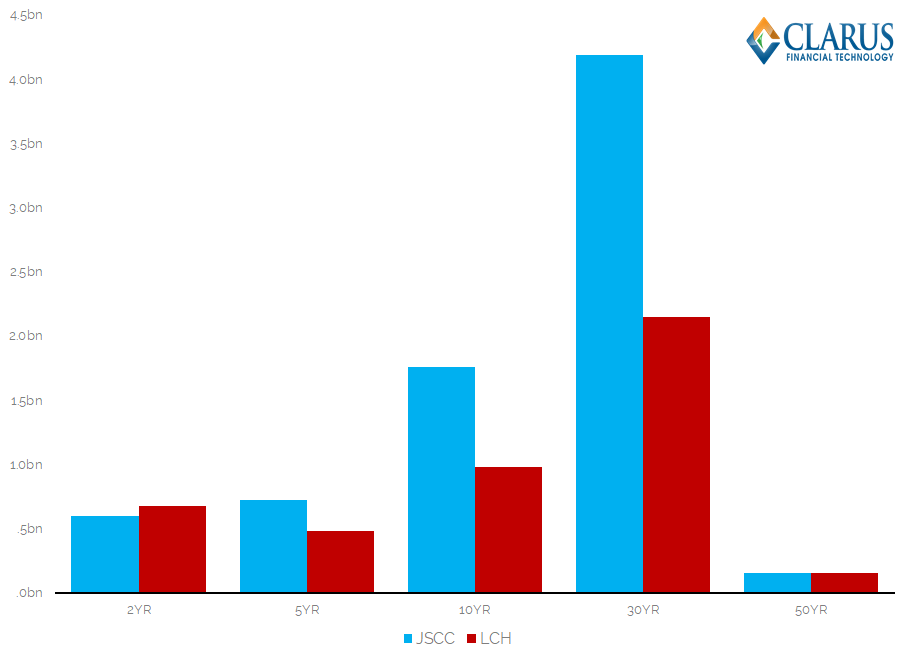
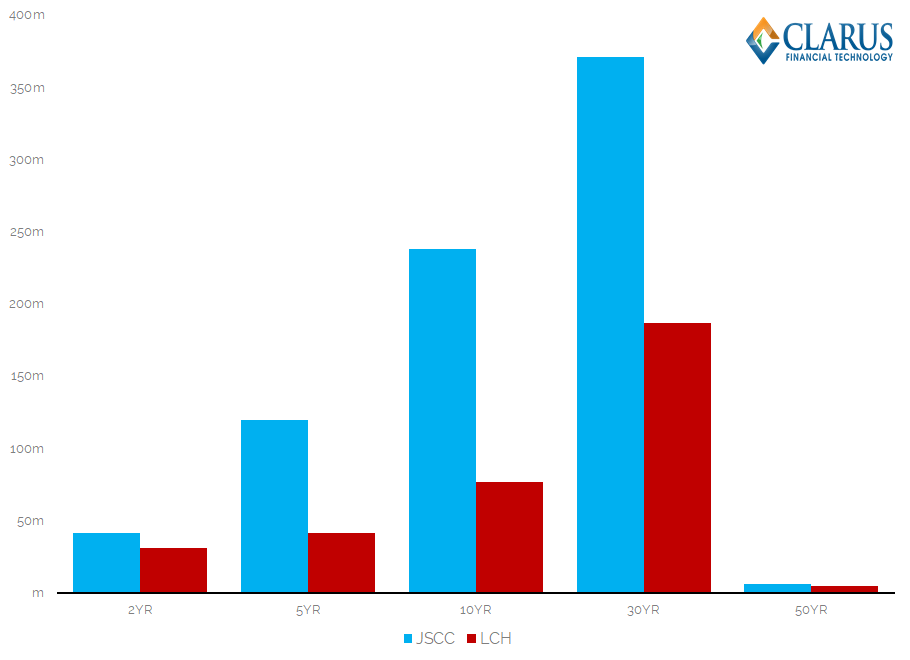
- JSCC have a lead in 5y, 10y and 30y tenors.
- Otherwise, the market share is pretty neck and neck in both 2y and 50y tenors.
- What I find most notable is the huge amount of risk that trades in 30 years. The chart shows that 1) the JPY IRS market is very long-dated and that 2) JSCC has a clear market lead in this important benchmark tenor.
- Across all tenors, the numbers are consistent with our notional measures. JSCC enjoy a 63% market share in vanilla JPY IRS.
What About OIS?
We cannot write an article these days without mentioning RFRs and OIS. So far in this blog we have looked at only JPY LIBOR swaps. What about the market share in TONAR, the JPY OIS index?
 Showing;
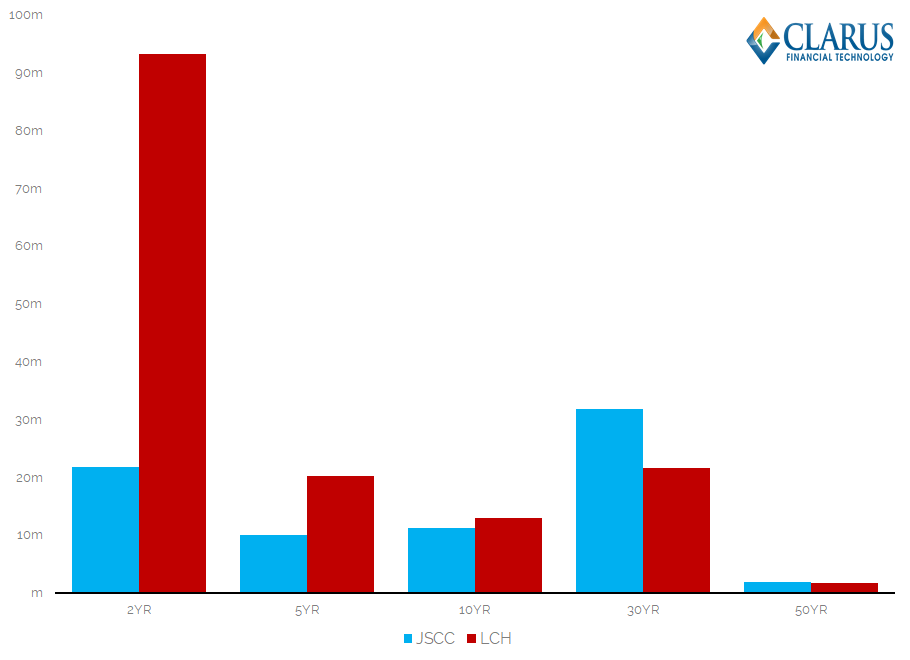
- The tables are turned here. LCH has a market share in JPY TONAR swaps of 67% (measured by DV01).
- Much of this volume is concentrated in short-dated tenors, 2 years and lower.
- The market shares are equal in 50 year swaps.
- And JSCC actually has a higher market share in 30 year tenors – of around 60%.
- Importantly, please note that this is a tiny market – it is orders of magnitude smaller than what is trading in LIBOR swaps at the moment.
- It will be fascinating to see how these market shares evolve as trading moves away from LIBOR in the coming years.
(We’ve touched on TONAR trading before as part of our OIS Trading and LIBOR Reform overviews. Well worth a read to put the different international markets in perspective).
And now onto the Basis
We can’t really write an article about JPY swaps without mentioning “the basis”. But before I come onto the JSCC-LCH basis, I first wanted to look at the market share in single currency basis trading in JPY. Anecdotally, we understand that very little of this trading is in TONAR(OIS)-LIBOR, and most of it is in TIBOR-LIBOR or, more likely, 3m vs 6m LIBOR basis (as a result of cross-border JPY issuance). Let’s look at the DV01 market shares here:
 Showing;
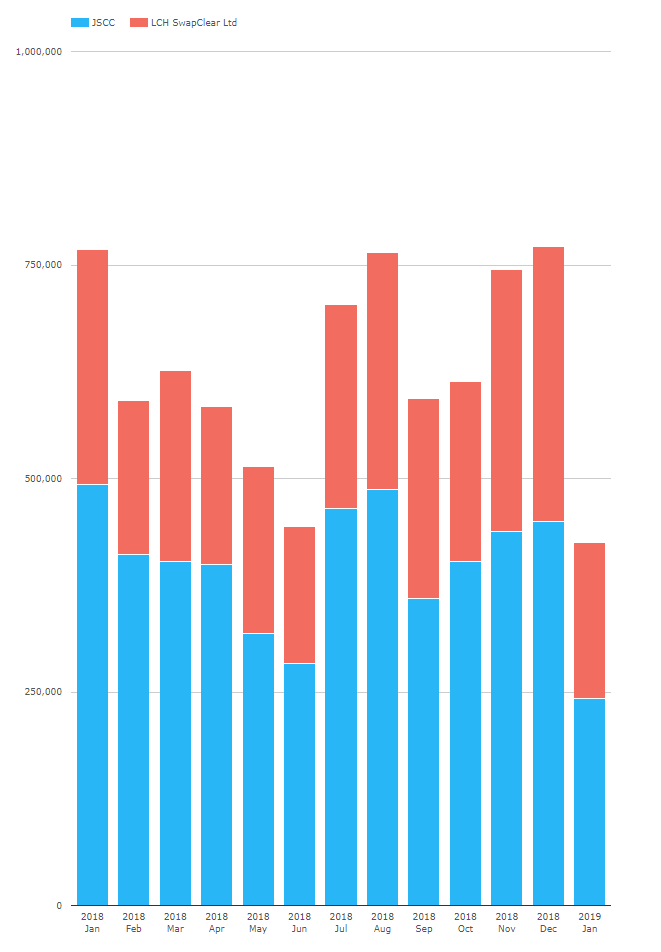
- This is a big market. Around ten times bigger than the outright TONAR OIS market for example.
- In terms of market share, JSCC is the dominant CCP in all tenors (even in 2 years, in contrast to vanilla IRS).
- Overall, JSCC has a 70% market share, a little higher than the market share in vanilla IRS.
So, what has been happening in JSCC basis trading? We can see that the price of the 10y basis between two 6m JPY LIBOR swaps has been declining steadily through the past quarter:
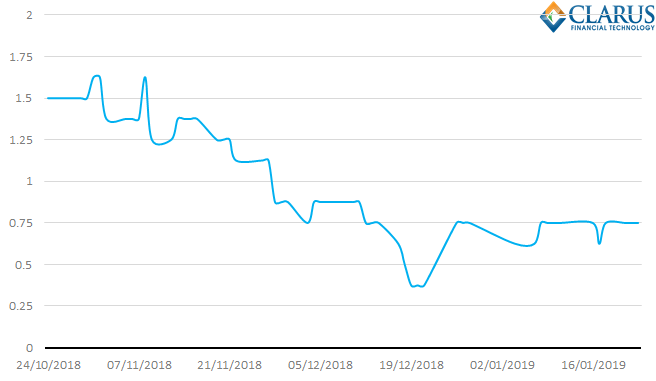
And we can see from the Trads screen below (thank you @Tradition) that the whole curve has moved well down from previous highs (check out our previous JSCC-LCH blogs here and here).

We know from various Risk magazine articles that the basis finally became wide enough for hedge funds to start to want to play, and that a speech from the CFTC at the end of last year sparked another downward move.
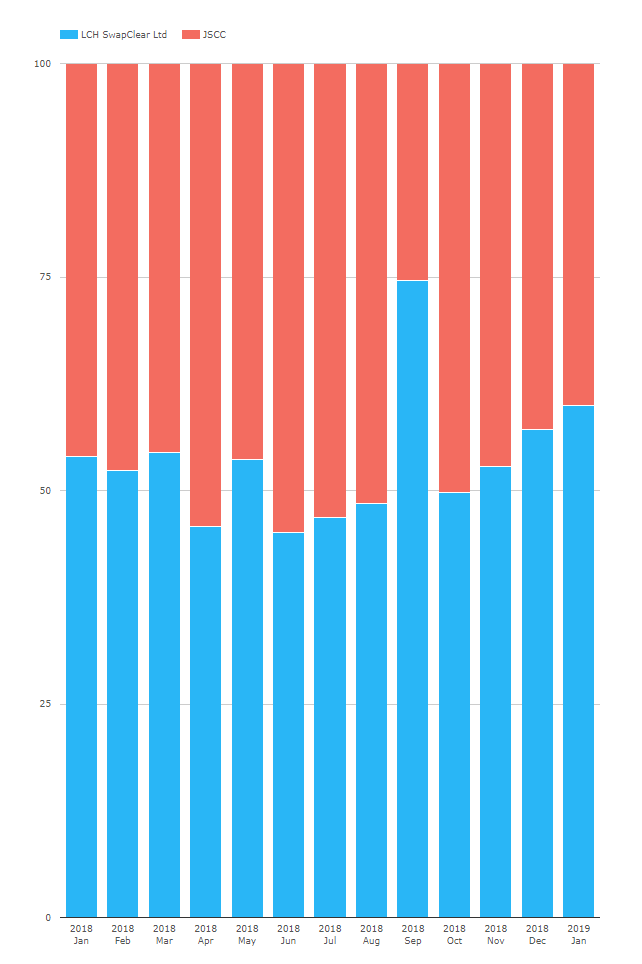
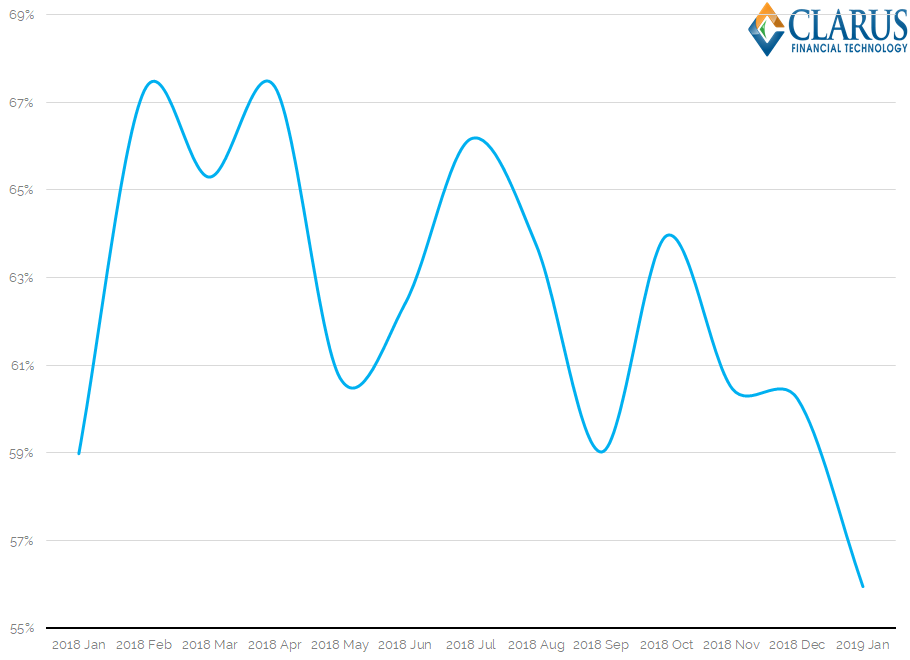
Has this move tighter in basis over time done anything to the market shares of the CCPs? It’s difficult to say. On a month-by-month basis, measured by DV01, the JSCC started 2018 with a 59% market share. This went up to 67% and has since come down to 56%. But it’s a very volatile time-series, so I would wait to see how this develops rather than drawing conclusions from a single chart:
Finally, it is worth noting that CME and Eurex also offer JPY clearing. CME sees regular monthly volumes, but have a market share of just 0.2%. Eurex volumes are far more sporadic.
And Clients?
Unfortunately, JSCC does not split their volumes between Dealer and Clients. This is a shame as it would provide valuable transparency to the market. LCH report a near 50/50 split for their volumes between Client and Dealer (in notional terms). It would be a worthwhile exercise to be able to compare these volumes, by tenor, versus JSCC to enable a full market picture. I’d love to see the previous chart for Client trades for example!
In Summary
- Vanilla JPY IRS regularly trades over $750bn equivalent per month.
- JSCC has had a market share ranging from 56% to 67% in the past year in IRS.
- LCH has had a market share of 67% in JPY OIS, but this remains a very small market.
- It is possible that the market share varies with the CCP basis (becoming more balanced when the basis is tighter). We will monitor this closely during 2019.