CME Volumes

CME volumes have hit $200Trn in some months this year. This is in Interest Rate Derivatives alone. The mix is roughly 60/40 Bond Futures versus Eurodollar futures. CCPView has now introduced volumes measured on a per contract basis, allowing for cross asset class comparisons. Interest Rate Derivatives CME is huge in Interest Rate Derivatives. Just […]
New Block Trading Rules for Derivatives
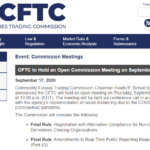
Amended 7th October 2020 to correct the changes to block and cap thresholds to 67% and 75% respectively. The block threshold for Swaps, and all other OTC derivatives, is changing. The thresholds for trades qualifying for block status and the reporting cap for notional amounts are also diverging. This will substantially increase transparency in the […]
Market Share in EUR Swaps
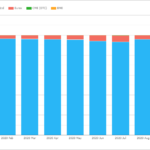
The recent news that ESMA to recognize three UK CCPs from 1 January 2022, has been well covered in the press e.g. see Reuters. The equivalence decision for a time limited period of 18 months, from 1 January 2021 to 30 June 2022, applies to ICE Clear Limited, LCH Limited and LME Clear Limited. And […]
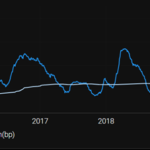
Spreadovers vs SOFR
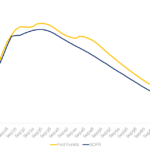
LIBOR swaps traded on spread to US Treasury bonds make up about 70% of interdealer liquidity. The floating leg of these swaps is about to be discounted at SOFR. This could lead the Spreadover market to start trading versus the SOFR index itself. We look at the differences between a LIBOR spreadover and a SOFR […]
SOFR Swap Nuances
This week, we take a look at the world of SOFR swaps and some of the intricacies associated with trading these OIS products. Nuance 1: Reset Lag and Payment Lag (courtesy of the Clarus blog) Overnight Index Swaps have a peculiarity concerning the fixing date (or publication date) of the underlying overnight rates. The fixing […]
RFR Data: Where is the €STR risk?
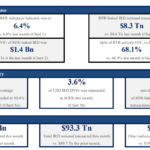
The ISDA-Clarus RFR Adoption Indicator has been published for August 2020. The headlines are: The RFR Adoption Indicator was at 6.4% in August 2020. This was pretty unchanged from 6.8% the prior month, and short of the highs hit in January 2020. 3.6% of all USD risk was traded in SOFR vs 3.8% last month, so no great change there. […]
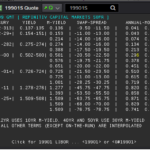
SGD Rates: SORA and the Fallback Rate (SOR)
A new Fallback Rate (SOR) will be used on SOR-referencing contracts in the event of a cessation of USD LIBOR. This rate should not be used in any new derivatives, and is only expected to be published for a period of about three years. As Clarus highlighted during the original ISDA consultation, the Fallback Rate […]
40% of the GBP Market Trades Versus SONIA
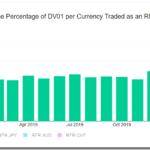
The ISDA-Clarus RFR Adoption Indicator includes currency specific measures on how much RFR risk is trading. These values are available as interactive charts on rfr.clarusft.com. Notable adoption of RFRs has occurred in both GBP markets (40%) and CHF (8%). We look at each of the six currencies covered by the indicator in this blog. Data […]
US Treasury Quarterly Refunding: Traded Volume Data
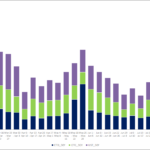
Clarus data for August 2020 shows a big increase in 30Y traded volumes in Rates products. This was specifically in USTs and exchange traded derivatives. Long-dated OTC derivatives did not see the same increase. The 20Y and 30Y US Treasury auctions, as part of the quarterly refunding cycle, were clear drivers of this volume. However, […]
Valuation challenges for non-cleared derivatives
The past few months I have been looking closely at the potential for valuations challenges over the last months and days of LIBOR with a potential cliff and wall as we approach December 2021. The rather benign pricing in the market predicts a very gradual ‘glide’ into the end but this may not actually be […]