Libor Fallback Trade Valuations – A single trade example
As the financial industry moves towards the replacement of LIBOR the question asked is changing from what does IBOR Reform mean, to how I manage IBOR reform? A key subsequent question is “What is the change in value/change in risk of my LIBOR trade if it goes onto Fallbacks?” I thought that it would be […]
SONIA Day 2 – LIVE Blog
COVID-19 has derailed many plans. One such plan was for interbank GBP swaps trading to move from LIBOR to SONIA on March 2nd. With the market volatility around that date, it just didn’t happen. We covered the subsequent changes in GBP activity here, here and here. The COVID-19 situation isn’t any better right now, but […]
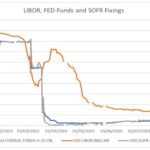
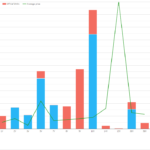
SOFR Live Blog
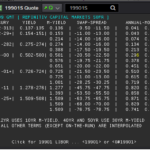
Please scroll down/click here for the latest updates. This blog covers both Monday October 19th and Friday October 15th in the SOFR market. LCH SOFR Auction With the LCH SOFR auction now a matter of hours away, we thought it would be worthwhile updating on the activity in SOFR markets. Yesterday was an all-time record […]
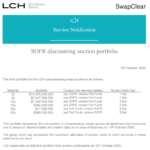
LCH SOFR Auction Versus The Market
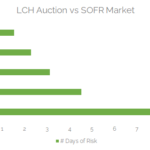
Update 09:45am EST 15th October. The final size of the LCH SOFR portfolio is now confirmed. It is about 15% smaller than the analysis below, at $9.1m gross DV01. The ISDA-Clarus RFR Adoption Indicator has been published for September 2020. The headlines are: The RFR Adoption Indicator increased to reach close to the January high. It was at 9.5% in […]
SOFR Swap Nuances
This week, we take a look at the world of SOFR swaps and some of the intricacies associated with trading these OIS products. Nuance 1: Reset Lag and Payment Lag (courtesy of the Clarus blog) Overnight Index Swaps have a peculiarity concerning the fixing date (or publication date) of the underlying overnight rates. The fixing […]
RFR Data: Where is the €STR risk?
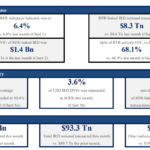
The ISDA-Clarus RFR Adoption Indicator has been published for August 2020. The headlines are: The RFR Adoption Indicator was at 6.4% in August 2020. This was pretty unchanged from 6.8% the prior month, and short of the highs hit in January 2020. 3.6% of all USD risk was traded in SOFR vs 3.8% last month, so no great change there. […]
40% of the GBP Market Trades Versus SONIA
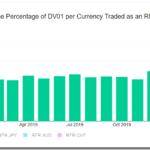
The ISDA-Clarus RFR Adoption Indicator includes currency specific measures on how much RFR risk is trading. These values are available as interactive charts on rfr.clarusft.com. Notable adoption of RFRs has occurred in both GBP markets (40%) and CHF (8%). We look at each of the six currencies covered by the indicator in this blog. Data […]
Valuation challenges for non-cleared derivatives
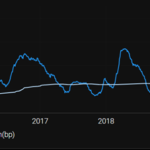
The past few months I have been looking closely at the potential for valuations challenges over the last months and days of LIBOR with a potential cliff and wall as we approach December 2021. The rather benign pricing in the market predicts a very gradual ‘glide’ into the end but this may not actually be […]
Calculate your own RFR Adoption Indicators
The ISDA-Clarus RFR Adoption Indicator provides a set of monthly metrics that firms can use to monitor the progress of RFR trading in IRD markets, both ETD and OTC. In this article, I explain why firms should also calculate RFR Adoption Indicators for their own trading. Background For those of you not yet familiar, below […]
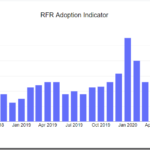
RFR Data: SOFR Sees Record Risk Traded
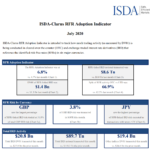
The ISDA-Clarus RFR Adoption Indicator has been published for July 2020. The headlines are: The RFR Adoption Indicator was at 6.8% in July 2020. This moved higher from 4.7% the prior month, reaching the highest level since February. Of particular note, 3.8% of all USD risk was traded in SOFR. This was higher than the […]