FX Derivatives (FXD) participants face a tricky choice across a patchwork of clearing and uncleared optimization techniques, trading off funding and capital usage with infrastructure spend and operational risk.
In earlier posts, we showed you how FX IM optimization via NDFs and FX Options clearing developed in Q1 2019. Here I update the volumes for Q2 2019 and set the trends alongside other emerging techniques in FXD counterparty risk reduction.
FXD Counterparty Portfolio Risk Optimization Solutions
We have seen five market solutions emerge with the object of minimizing FXD counterparty risk.
- NDF clearing. FX NDFs in non-deliverable currency pairs have shifted towards clearing in response to the uncleared margin rules and other regulations.
- FX IM optimization via NDFs. FX NDFs in deliverable currency pairs have been used by IM optimization vendors (TriBalance and Quantile) to optimize SIMM IM associated mainly with FX options. See my blog here. This resulted in material volume increases in uncleared FX NDFs along with a smaller increase in cleared NDF.
- FX options clearing. Banks started materially clearing FX options at LCH ForexClear sometimes with associated FX forward hedges. See my blog here.
- Standalone deliverable FX forwards clearing. Recently LCH ForexClear announced a standalone FX forwards clearing was available.
- FX forwards counterparty risk optimization. Counterparty credit RWA has been tackled through the advent of risk optimization vendors (LMRKTS and TriReduce). There are no public volumes due to the FX forwards exemption from SDR reporting so I’m relying on the vendors’ own descriptions. This topic warrants a separate post which I hope to produce soon.
The principal driver for items 1-3 is the desire to head off bank funding costs associated with UMR SIMM IM with turned out to grow faster for FXD than for IR derivatives.
The principal driver for items 4 and 5, on the other hand, is to reduce counterparty credit risk-weighted assets (ccRWA). This is not a funding cost but contributes to (the denominator of) a bank’s capital ratio. More RWA makes the ratio go down (bad) and may lead to a need to increase the amount of regulatory capital a bank is required to hold. Anecdotally, FXD is one of the largest OTC asset classes in terms of its consumption of ccRWA (despite what you may have heard about swaps and forwards being short dated, low risk…).
One might reasonably hope for a single solution to optimize both SIMM IM funding and ccRWA in a future state. For example:
- A multilateral IM/risk optimization run could optimize both SIMM IM and aggregate counterparty portfolio risk across SIMM and non-SIMM portfolios at the same time in one run.
- A CCP might clear all FXD products to take trades out of both SIMM IM funding (e.g. NDFs, options) and out of unmargined ccRWA (e.g. FX swaps / forwards) whilst enabling optimization of the cost of CCP IM which, for FX swaps and forwards, is more punitive than SIMM IM.
While more complete multilateral solutions evolve, participants face combining several solutions to optimize several funding and capital metrics.
(Note: our Charm product allows customers to analyse their cleared portfolio, as well as counterparty SIMM CSA and legacy CSA portfolios to search for opportunities to reduce risk and quantify impacts).
Below we look at items 1-4 above against Q2 volumes to confirm or update our understanding.
1. NDF clearing
Looking at CCPView and SDRView side by side we have the following:
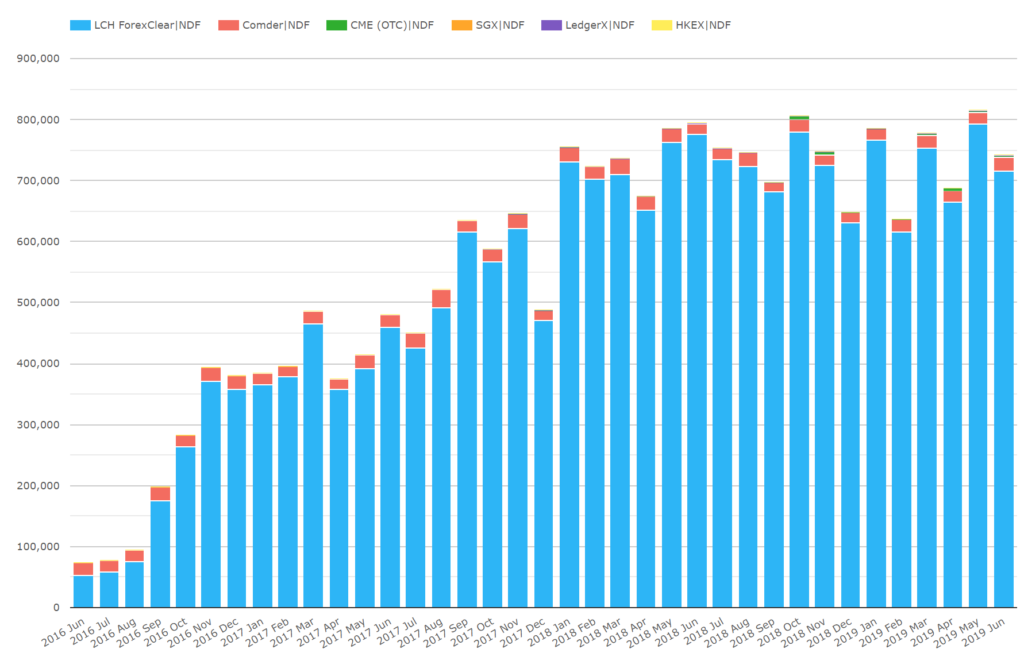
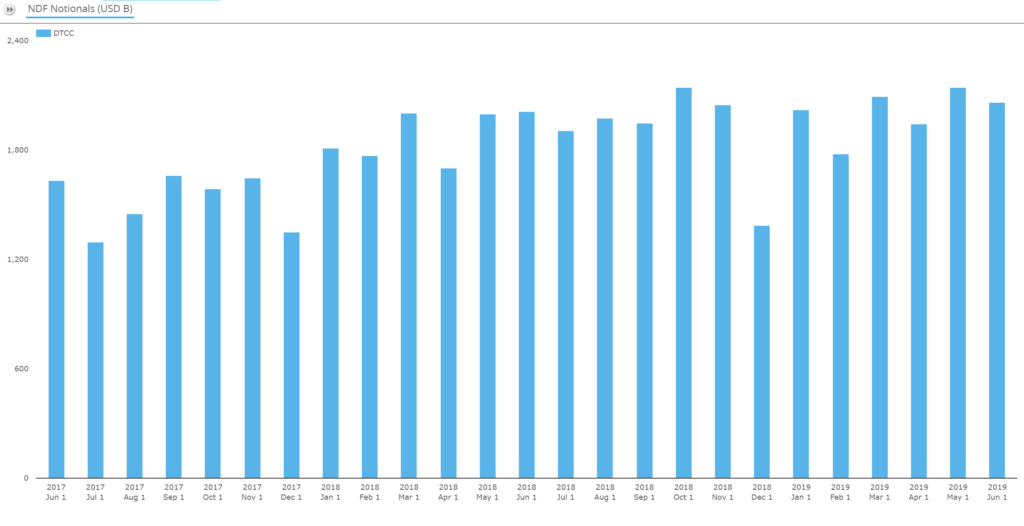
We see:
- A major increase in cleared NDFs from 0.1tn in mid-2016 plateauing from 2018 onwards in the $0.7tn to $0.8tn range.
- This compares with US volumes in the $1.8 to $2tn range so perhaps $3-4tn globally.
Observation: The effect appears to have plateaued in Q2, perhaps awaiting UMR Phase 4 to get more momentum.
2. FX Options IM optimization via NDFs
If you remember from my blog, FX Options only trade on deliverable currency pairs so we need to limit our charts to those pairs.
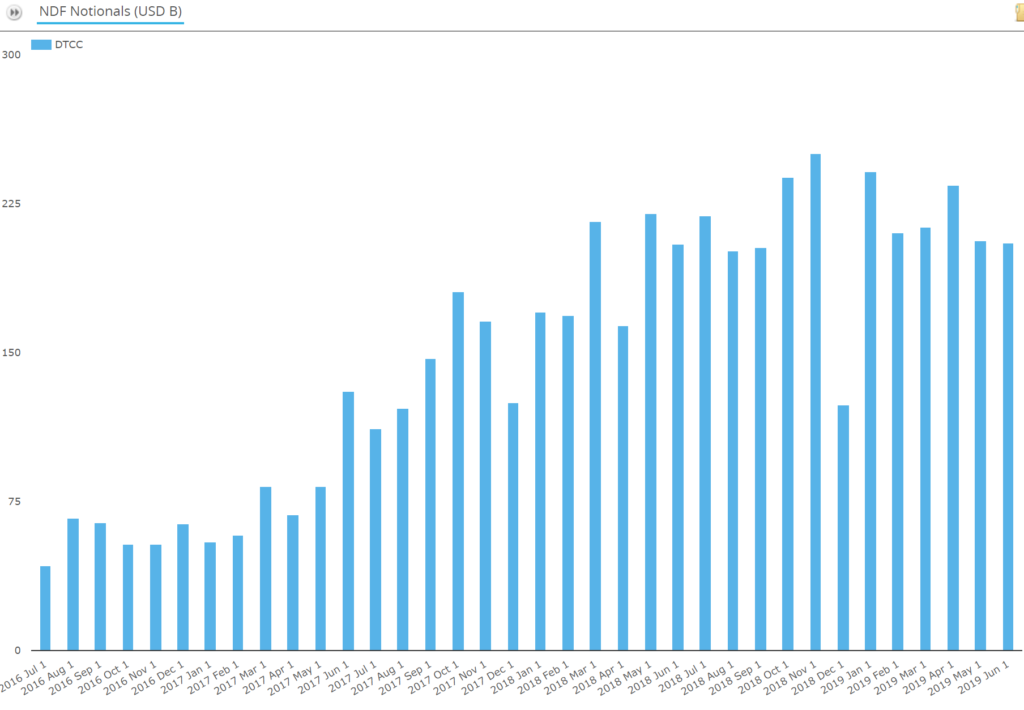
We see:
- US reported deliverable currency pair FX NDFs grew from $40bn per month (4% of all pairs NDFs) in mid-2016, to $190bn per month (10% of all pairs NDFs) in mid-2019
- Global deliverable currency pair cleared FX NDFs grew from nil in late 2017, to $10bn per month in mid-2019
- The main volume change is the increase in uncleared deliverable FX NDFS
- 4% of June US reported NDFs (totaling about $2tn) would be about $80bn, so about $110bn additional US reported notional has been created by this effect.
Now let’s look again at the daily patterns over recent months:
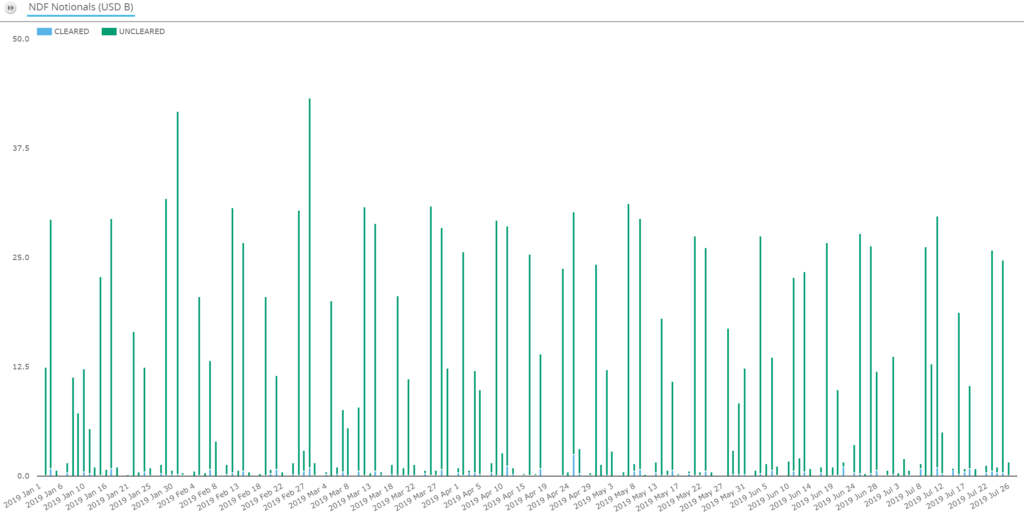
We see:
- A continuation of the Tuesday and Thursday pattern of volume spikes observed in my prior post with not much volume on the days in between (I checked the days of the week…)
- Just by eye, daily peaks and monthly volumes have plateaued – suggesting steady-state run volumes have been reached.
Observation: more of the same. Feel free to review my prior blog for more details.
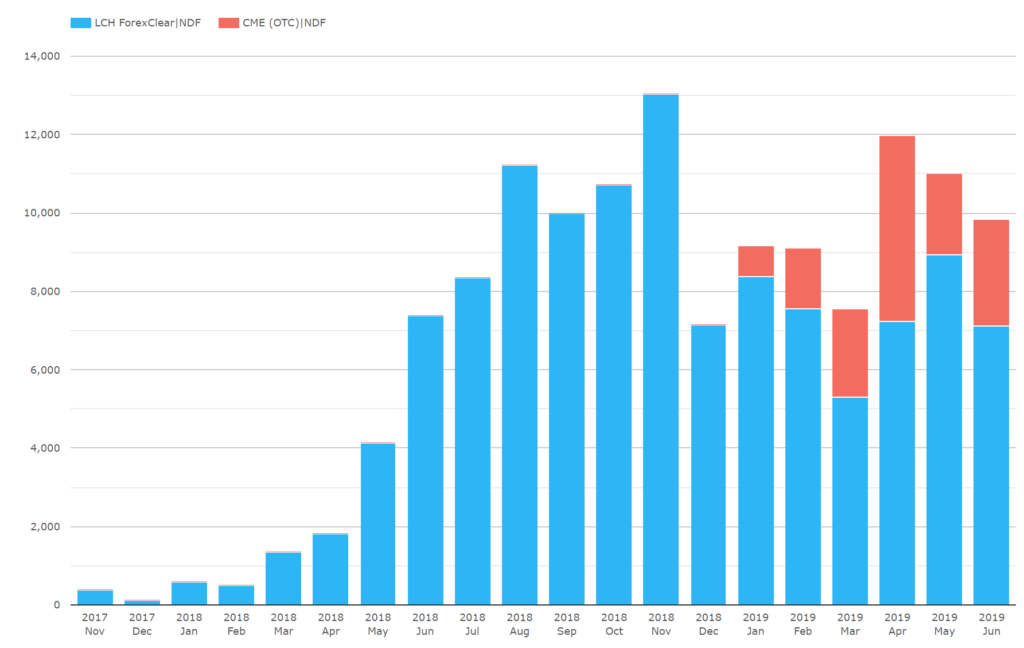
In passing, let’s take a quick look at clearing market shares.
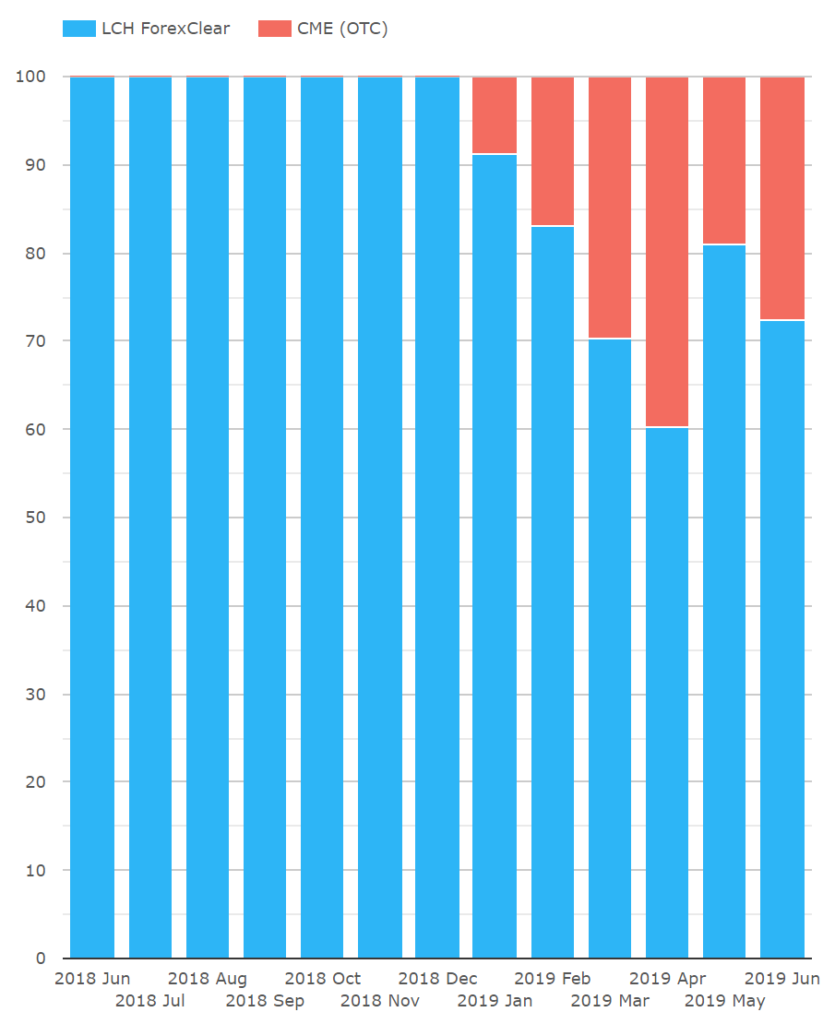
We see:
- In Q2, CME consolidated and sustained the 20-30% share of deliverable pair NDFs it took in Q1 from a standing start
- For clarity, these are shares of $~10bn cleared deliverable pair NDFs two charts further up.
- By contrast, the all pairs cleared NDF market is $~800bn per month and remains dominated by LCH ForexClear – see the first chart near the top of the post.
Terminology note: CME uses the term cash settled forwards (CSFs) for deliverable currency NDFs as I call them.
3. FX options clearing
In Q1, we saw FX options clearing ramp up. In Q2, we also heard of the launch of FX forwards standalone clearing (“standalone” meaning FX forwards which are not delta hedges of FX options). In Q2, what have we seen?
First, let’s look at the US FX options market as a whole.
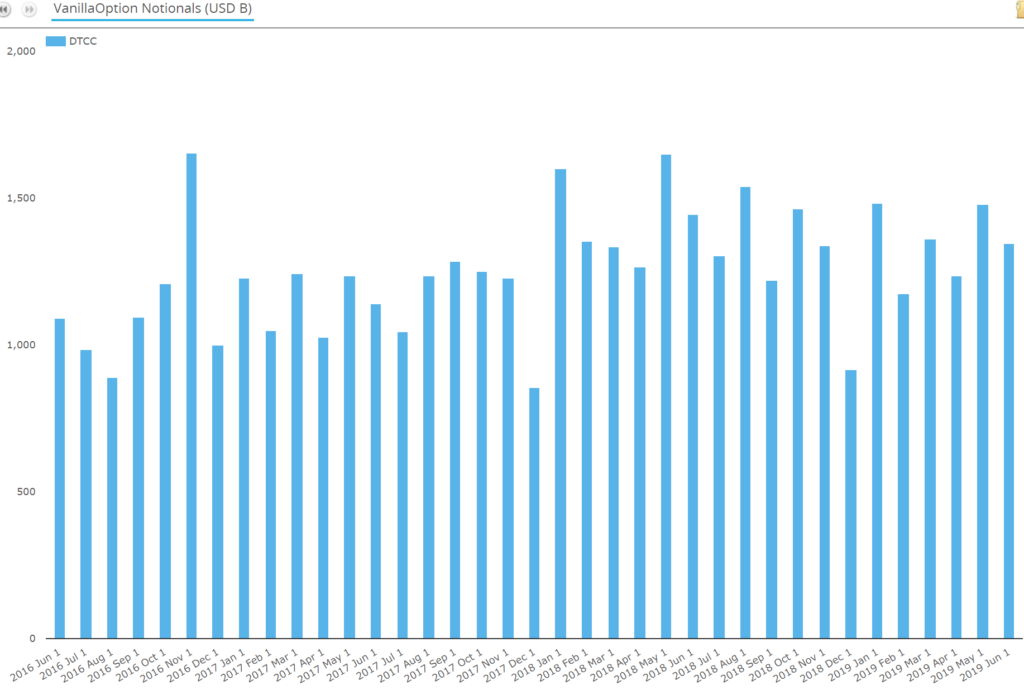
We see:
- It’s big – volumes are in the range $1tn to $1.5tn in most months
Now, let’s look at the deliverable currency cleared FXD market.
CCPView Global Cleared FXD – Deliverable Pairs (e.g. EURUSD)
In case the deliverable pair / product semantics makes your head hurt, let’s recap terminology with some examples:
- Deliverable pairs e.g. EURUSD, GBPUSD, USDJPY etc.
- Non-deliverable pairs e.g. USDBRL, USDCNY etc.
- Deliverable products e.g. FX spot, FX swap, FX forward, FX option
- Non-deliverable products e.g. non-deliverable forward (NDF), non-deliverable option (NDO)
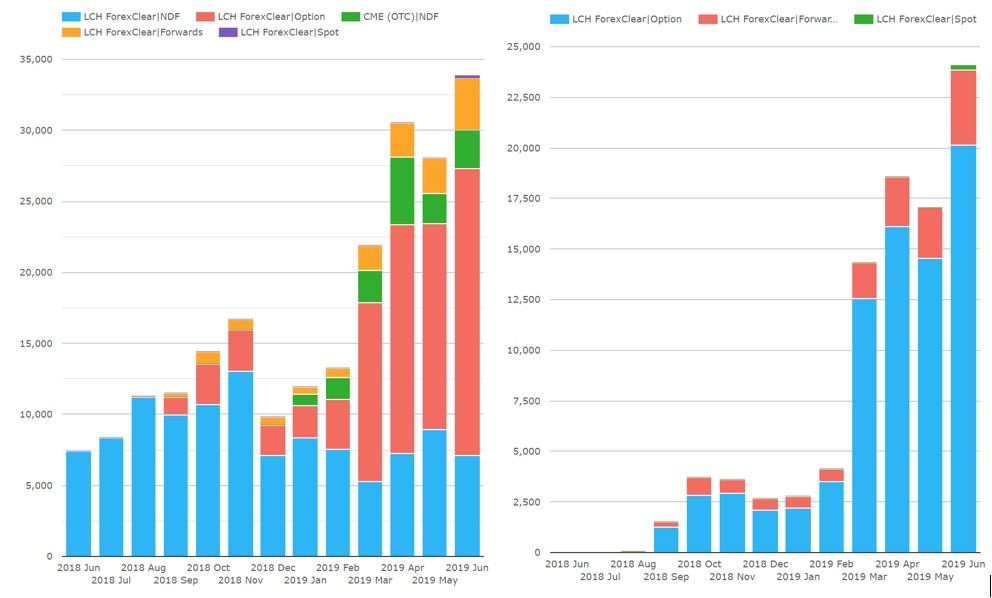
We see:
- Cleared deliverable pair FXD increased from $~22bn in March to $~34bn in June.
- Cleared Deliverable pair FXD remain tiny at about 0.1% of US reported FXO and NDF (combined total $3.4tn in June – from charts further above)
- Deliverable pairs FXD have a markedly different clearing product split than non-deliverable pairs with deliverable products dominating non-deliverable products by about 2/3 or $24bn to 1/3 or $10bn.
- FX options (in deliverable pairs) increased from $12.6bn in March to $20.2bn in June – a ~60% increase
- Cleared FX options remain less than 2% of global FX options traded notional, given US reported alone are roughly $1,000bn to $1,500bn a month.
Observation: FX options clearing continues to grow materially and quite rapidly. At this point, I take back the doubt expressed in my prior post that the March spike might be a quarter end phenomenon. It has been sustained and expanded upon. Now, eyes must be on when we get to $50bn or $100bn.
4. Standalone deliverable FX forwards clearing.
In the figures above, we see:
- Deliverable forwards increased from $1.8bn in March to $3.7bn in June – a ~100% increase.
Observation: I am informed that ForexClear are homing in on clearing their first standalone FX forward but haven’t done so yet. FX forwards outgrowing options in percentage terms only indicates increased FX options delta hedging.
Can Deliverable FXD “clear big”?
LCH have been in the press saying that as much as 50% of the FX Options could be cleared (here). Because the FX reg. exemption creates a non-SIMM actively traded uncleared portfolio along with the SIMM uncleared portfolio and legacy portfolio, uncleared solutions for FXD have been particularly patch work – one for SIMM IM another for non-SIMM RWA. This gives an extra appeal of clearing for FXD as all the risk contained in a traded FX option and its hedge land in a single counterparty risk pot and offset one another to reduce counterparty risk and margin. However, there remain challenges:
- Clearing infrastructure capacity. If FX options reached 50% cleared this would mean $500bn – $750bn cleared a month – a 25x or more increase over June 2019 volumes. This looks like several years work for the collected market participants to ramp up enough clearing members and enough client clearing providers with enough margin funding buffer etc. Clearing would need to be automated at the similar levels to IRS automation e.g. clearing determined from the SEF/MTF onwards (today they are backloaded post trade). I can, nonetheless, see these challenges being overcome in time.
- Non-linearity / lack of liquidity. FX options share some characteristics with their IR Swaptions cousins, which stopped clearing at the end of 2018. Arguably FX Options are simpler, shorter dated, more liquid and with more widely available volatility data, both current and historical. Meaning OTC options in other asset classes are likely to follow FX options rather than lead a move to clearing.
- Cleared IM volatility – unlike IRS / IR swaption which are non-cash notional, big swings in CCP IM can happen each time a deliverable FX pair settles at inception, exercise or maturity of a trade. I can imagine ways to handle this manually but these processes would need to be automated to scale reliably from $20bn to $100bn or $500bn per month?
- CLS limits / operational risk – for the longest time in the early part of this decade, CLS was commonly held to be a commercial or risk management stumbling block for deliverable FXD clearing The Fed was adamantly against CLS disruption. Or perhaps CLS would lose revenue from netting happening in the CCP instead of at CLS. This has clearly been overcome to the tune of $20bn cleared a month. However the question remains on whether this could act as a constraint to scale.
Pointing out potential issues, is an important step in figuring out industry solutions to overcome bottlenecks, so clearing can continue to scale. Deliverable options and standalone forwards clearing have been launched and are operating at a meaningful scale with volumes rising materially month by month.
Deliverable FXD clearing at scale would be ground breaking in terms of the effect on systemic counterparty risk and its usage of financial resources.
Conclusion
For FXD, less regulation has allowed more types of solutions for counterparty risk / IM reduction to co-exist than for other asset classes. No doubt further enhancements are to come, but the solution table is set. A participant can now choose to invest in clearing infrastructure to be able to pay CCP IM to reduce SIMM IM or ccRWA or to invest in infrastructure to participate in multilateral IM/risk optimization with only limited clearing or to focus on other in-house tools and initiatives.
With no clearing mandate and some products exempt from uncleared IM, more is left to a participant’s own decision balancing incentives of funding, capital and infrastructure costs.
Our Q2 2019 CCPView and SDRView volumes indicate all of these are living and breathing solutions.
Only time and a lot of hard work across the industry will tell, which become dominant in scale.
Takeaways
We will monitor the above volumes quarterly going forward to observe how things shake out.
The next big calendar fixture is UMR Phase 4 in Sep-2019, which may produce a boost for one or more of the solutions outlined.
To dig deeper into the volumes using CCPView and SDRView or get a demo of counterparty risk analysis in Charm, please email us at [email protected].