Staff Working Paper No. 800 from the Bank of England was published in May 2019. Titled “The Cost of Clearing Fragmentation”, the paper lays out a quantitative process to model the level of CCP basis.
We’ll give you a layman’s guide to the paper here and show how our own data from CCPView can be used in the model.
What is CCP Basis?
The paper is kind enough to cite Clarus a couple of times (our CCP Basis and Volumes blog, plus our 2017 CCP Market Share Statistics). The paper could also have said that we’ve been writing about CCP Basis since June 2014! Check out our blogs on the topic under CME-LCH Basis.
Back in 2015, CCP Basis was actually our most read blog of the year. Nowadays, CCP Basis has become the norm and is widely accepted in the market. We last wrote about it over a year ago, so the BoE paper gives us a good excuse to refresh some of our own analysis.
The paper states;
Fragmenting clearing across multiple central counter-parties (CCPs) is costly. This is because dealers providing liquidity globally, cannot net trades cleared in different CCPs and this increases their collateral costs. These costs are then passed on to their clients through price distortions which take the form of a price differential (basis) when the same products are cleared in different CCPs
BoE Staff Working Paper No. 800
That is about the best one paragraph explanation I’ve seen – well done to the authors. Whilst we’ve looked at Margin Management, Hedging, Term Structures and even Arbitraging the Basis, it is collateral costs that rule the roost.
What is the Model?
The authors propose a succinct model that tracks the evolution of the basis and is statistically significant. The inputs are:
- A per unit cost of collateral.
- Asset volatility multiplied by the net notional at each CCP (i.e. a proxy for the Initial Margin held).
- The fraction of market participants who are price-sensitive and that can choose to clear at either CCP.
For those that can bear the equations, I suggest you check out the paper itself, and pay particular attention to Equation (1).
For those of a less technical nature, read on.
Hypotheses
The model enables the following hypotheses to be tested using a unique LCH SwapClear data set, which includes counterparty identifiers:
- Basis increases with collateral posted at LCH.
- Basis decreases as LCH market share of non-dealer participants increases.
- Basis increases as funding costs increase.
- Basis decreases as client paying at LCH increases.
The Tests
This is the best part of the paper. The authors test the equation;
\( \tag {1} Basis_{t} = a + b.Collateral_{t} + c.FlexRatio_{t} + d. LiborSpread_{t} + u_{t}\)
where;
Collateral = IM posted at LCH by all dealers
FlexRatio = Fraction of dealer-to-client volume at LCH transacted by non-dealer banks
LiborSpread is the difference between 3m USD LIBOR and Fed Funds overnight rate.
It is worth exploring the FlexRatio definition a bit more. From the authors:
We use the fraction of volume traded by non-dealer banks as a proxy for the amount traded by price-sensitive market participants who can clear flexibly in either CCP. We do this because all banks in our sample have access (through their subsidiaries) to both LCH and CME and thus can in principle clear through either CCP. This measure may not necessarily capture all market participants with access to both CCPs but it should account for the majority of flexible participants given that most non-bank entities (e.g. asset managers, hedge funds, etc.) typically only access (directly or indirectly) a single CCP.
Staff Working Paper No. 800 The cost of clearing fragmentation
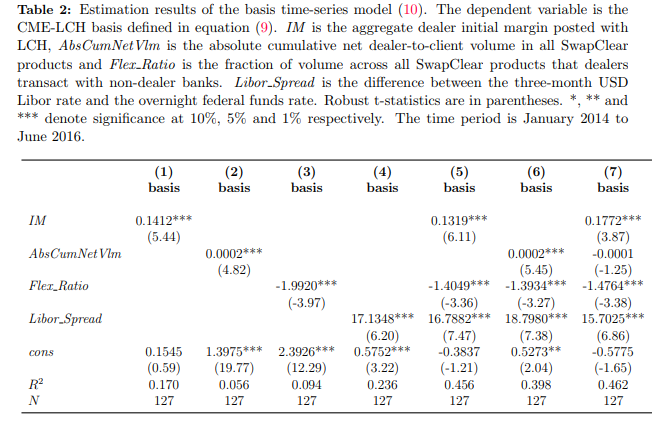
The Results
The results as presented in the paper are a little difficult to digest. But I think they tested 7 maturities of basis from 2 years all the way to 50 years, and verified the impacts of IM, D2C activity and Collateral Costs on the basis. For those who insist on the full statistical breakdown:
Liquidity Coverage Ratio
Hearty congratulations to the authors for making this paper easy to read. They even throw in some interesting side-angles that you don’t typically get in something quite academic. I found their comments on the Liquidity Coverage Ratio particularly interesting:
The increase in the CCP basis could be associated with the phased-in implementation of the Basel III liquidity coverage ratio (LCR), which requires banks to hold high quality liquid asset (HQLA) against their estimated 30 days’ cash outflow. IM is counted as cash outflow with a penalization of 20%, i.e., 1 unit of IM counting as 1.2 units of cash outflow. The LCR requirement became effective from Jan 1, 2015 at 60% rate and rose to 70% in 2016. This has likely further increased the cost of IM for dealers. See https://www.bis.org/bcbs/publ/d354.pdf.
Footnote 15
Sounds like there is a blog waiting on LCR there…..
Clarus Data
It strikes me that the data used in this model is replicated in our Clarus data set. That means market participants can use our up-to-date time-series to tell them where the theoretical value of CCP Basis should be. How? I’ll show you below.
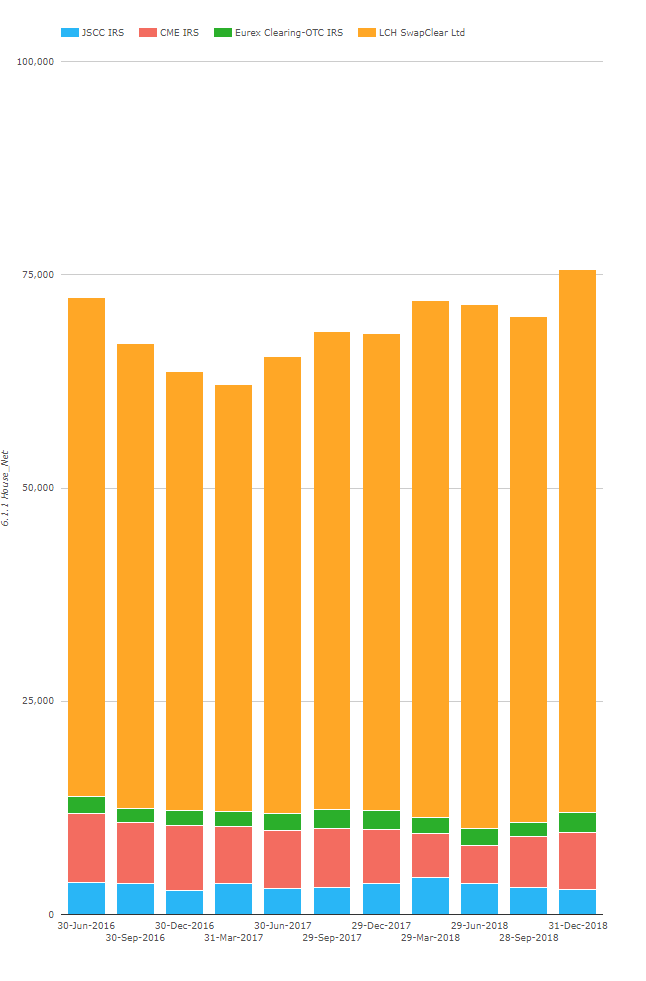
Collateral
We know the total Initial Margin held at a number of CCPs, plus the split between House and Client. For the purposes of the CCP Basis model, we want to know IM held by House Members for IRS. This is disclosure 6.1 in CCPView Disclosures:
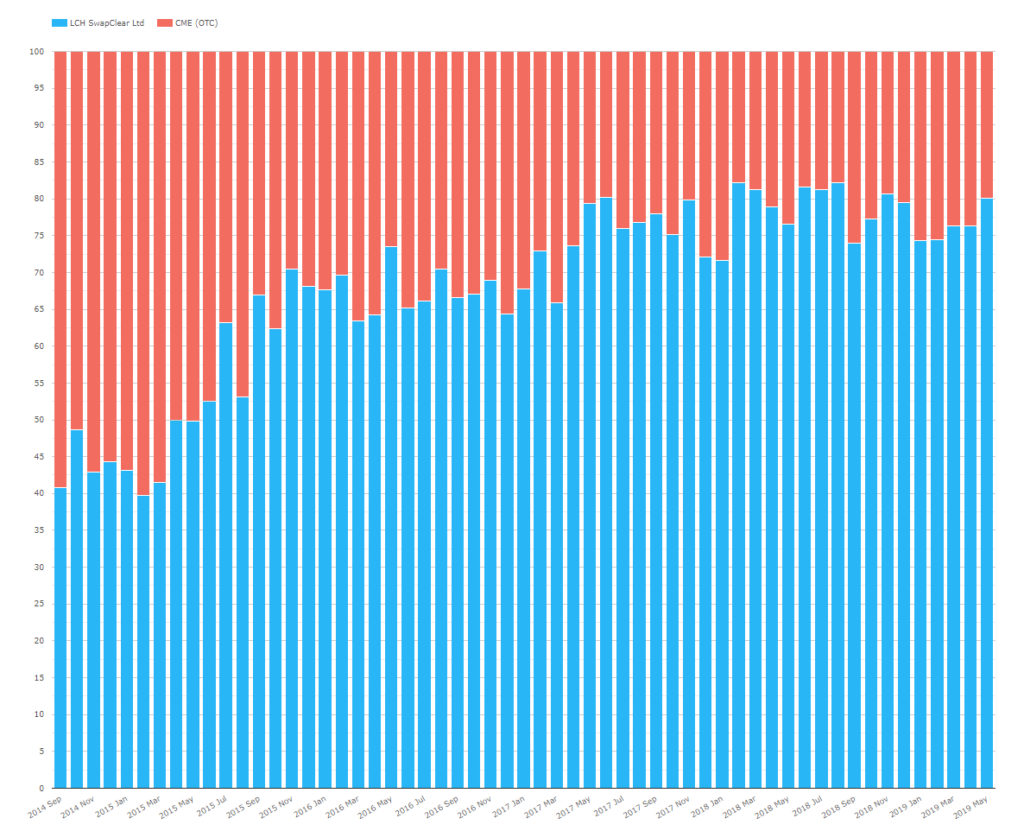
FlexRatio
We can suggest using the percentage split of Dealer to Client flow as a proxy for the Flex Ratio. Whilst it doesn’t tell us precisely where non-dealer banks are transacting, it is a good proxy.
Basis Levels
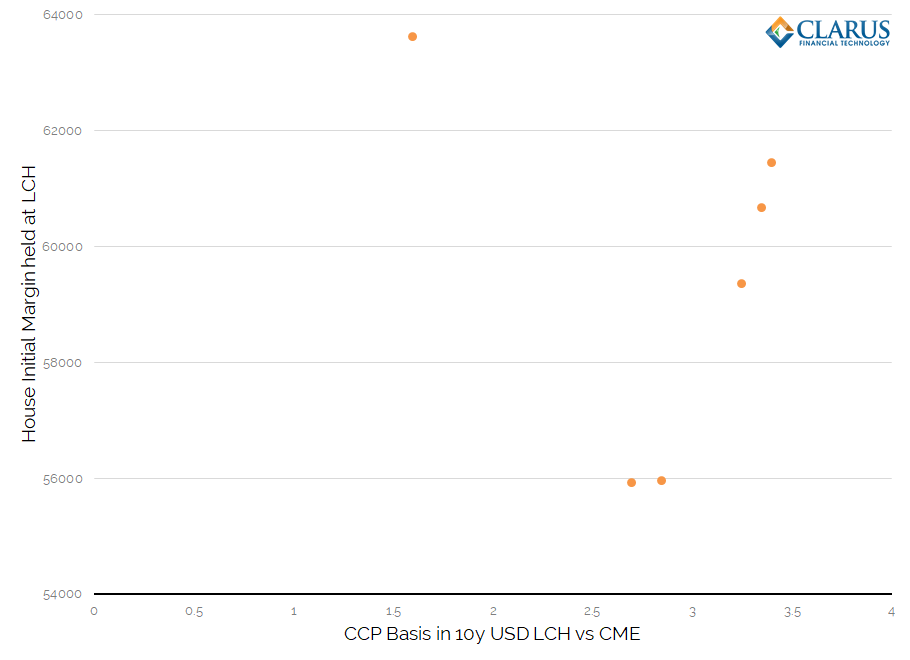
Time forbids me from implementing the full model, but let’s look at the evolution of CCP Basis versus those two variables above:
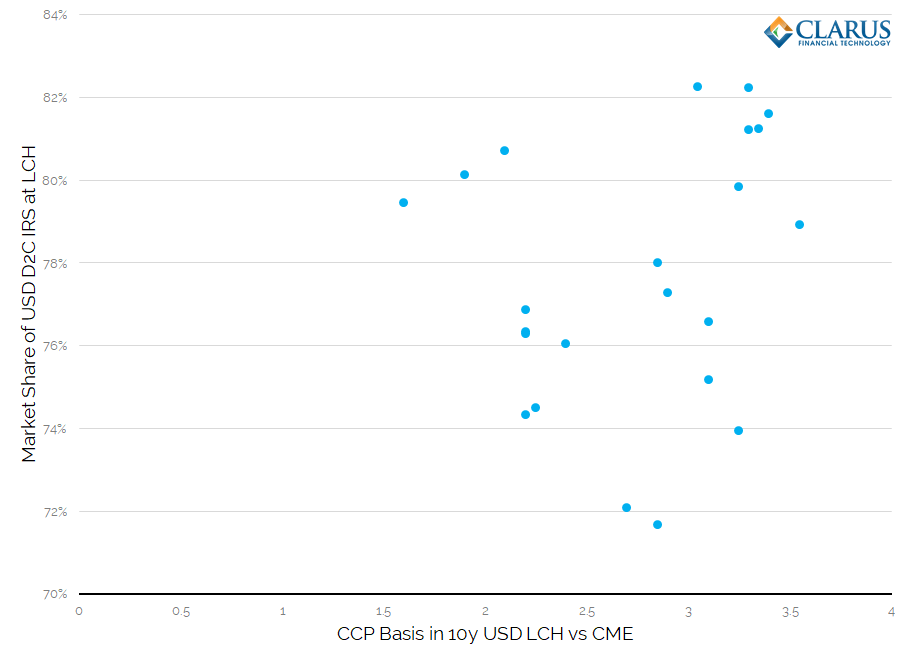
That chart makes the relationship look very promising! I’ve just plotted monthly levels, but certainly worth a closer look.
Clearly the second chart is less compelling. But of course the strength of the model is likely to be in the combination of all of the variables at hand.
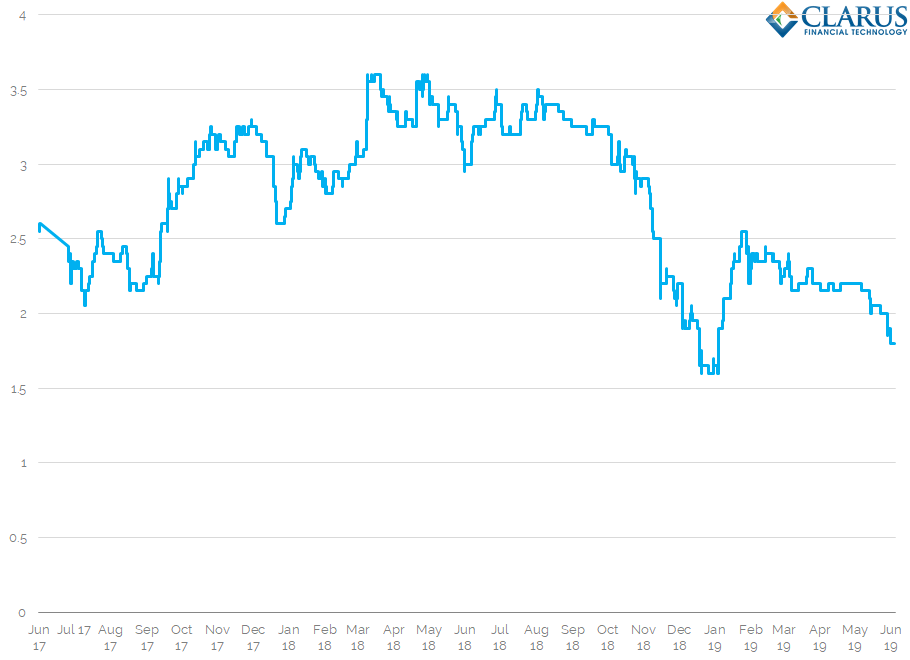
Below is the evolution of the LCH-CME Basis in 10y USD since 2017 – kindly provided by ICAP. With the basis here to stay, it is surely worth spending time to implement this model to assess where the basis should theoretically be.
In Summary
- We present the CCP Basis model from the recent BoE Staff Working Paper.
- The model uses the level of Initial Margin, the choice of CCP from price sensitive counterparties and the funding cost of collateral as inputs.
- We show how Clarus data can be used to replicate the model with recent data.