- The same 30 banks as in 2019 have been defined as GSIBs in 2020.
- JP Morgan, Wells Fargo and Goldman Sachs have all managed to move into lower tiers, requiring less capital.
- We look at the data behind the GSIB indicators using GSIBView, our latest data offering.
- Optimisation of the GSIB metrics is evident in the data and is particularly important because the indicators are assessed relative to a bank’s peer group.
Global Systemically Important Banks
By means of introduction, please consider the GSIB regime in four bullet points:
- Banks are assessed on 12 indicators as to how systemic and how global they are.
- Banks are then ranked and given an overall score across these 12 indicators.
- As a bank, your ultimate score is not only reliant on your own activity – it is also subject to what your peers are doing.
- Depending on a bank’s score at the end of this quantitative assessment, an additional amount of Tier One capital (CET1, Common Equity Tier 1) must be held by the bank. The exact amount ranges from an additional 3.5% to zero (see table below).

In 2019, 30 banks qualified for the Bucket 1 designation or higher. They were therefore required to hold at least an additional 1% of Tier One Capital as a result of being classified as a G-SIB.
Tier One capital is expensive. It is typically estimated to carry a cost of around 10-15% per year. This is the expected average Return on Equity that the banking industry operates under.
GSIBs in 2020
Last month, whilst we were all busy looking at SOFR and SONIA as the RFR markets moved front and centre, the FSB (Financial Stability Board) published the “2020 G-SIB list“:
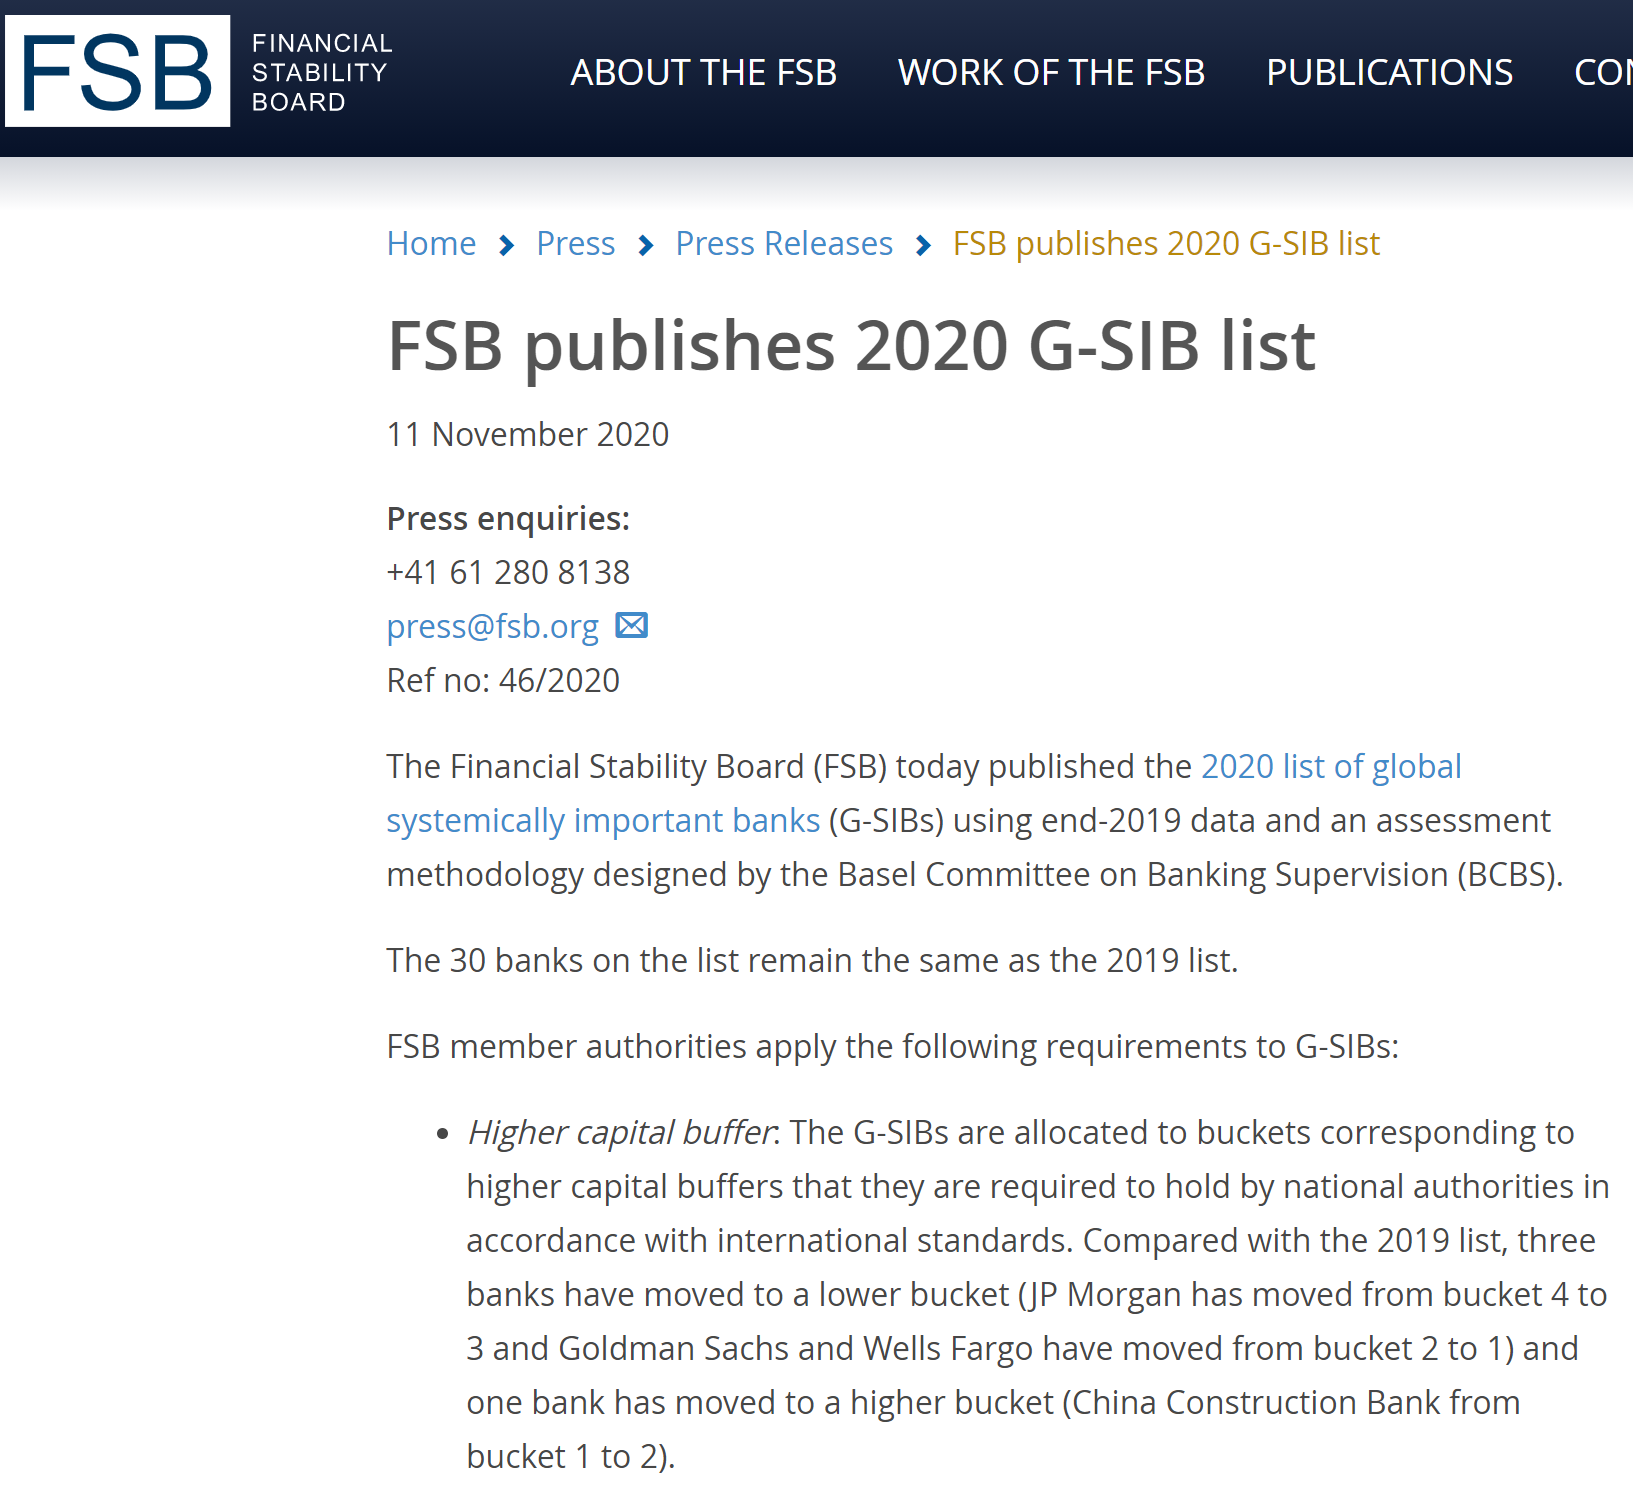
There were again 30 banks who made the list. The headlines, as selected by the FSB were:
- JP Morgan moved down from bucket 4 to bucket 3.
- Goldman Saches moved down from bucket 2 to bucket 1.
- Wells Fargo also moved down from bucket 2 to bucket 1.
- China Construction Bank moved up from bucket 1 to bucket 2.
GSIBView from ClarusFT
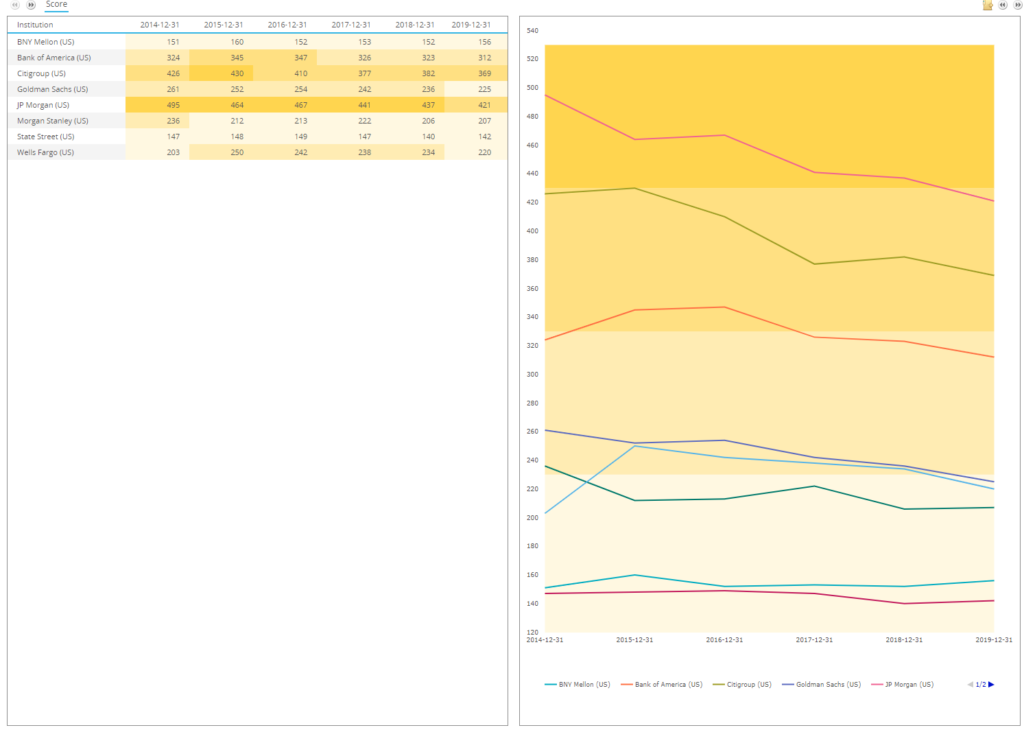
We have standardised the collection of the annual and quarterly metrics of GSIBs into a new data product, called GSIBView (see our announcement from March). This is a particularly important tool because GSIB scores are based on a bank’s relative performance to their peers. Having a data-set that reflects the peer group is therefore necessary to be able to optimise the metrics.
We can then drill-down on banks, such as JP Morgan, to see how they achieved a drop from Bucket 4 to Bucket 3 on a standalone basis:
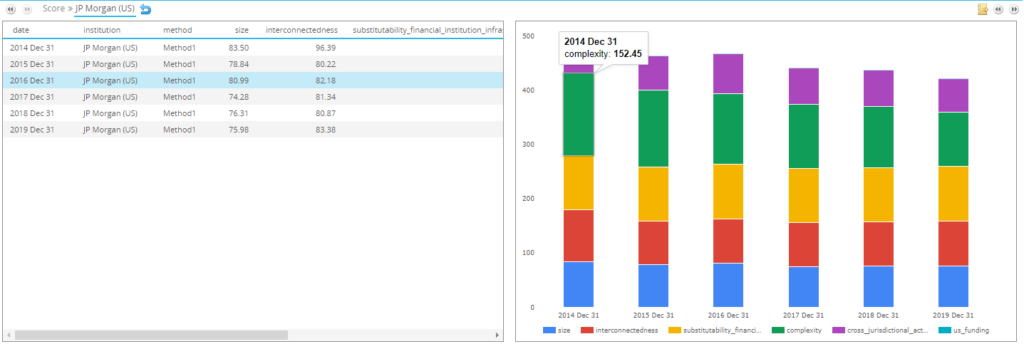
The largest drop for JPM came from the “Complexity” indicator, which can again be drilled-down into:
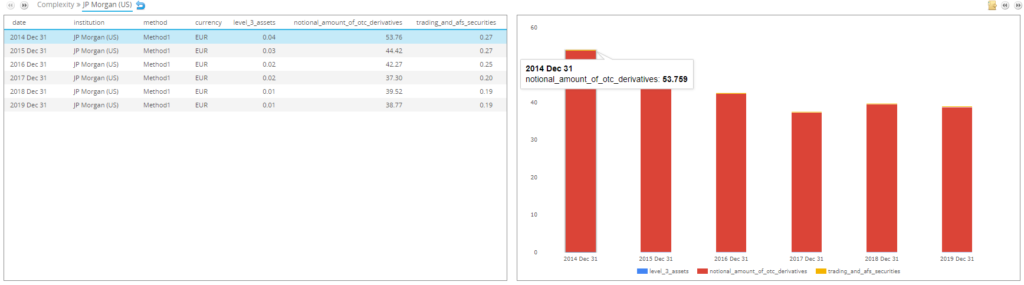
The data shows that JPM were both successful in:
- Reducing (i.e. compressing) notional of OTC derivatives by nearly $1trn over the year.
- Reducing their Level 3 Assets from $15bn to $12bn.
Goldman Sachs
For Goldmans, the story is different. They were able to reduce every single component of their GSIB score this year!
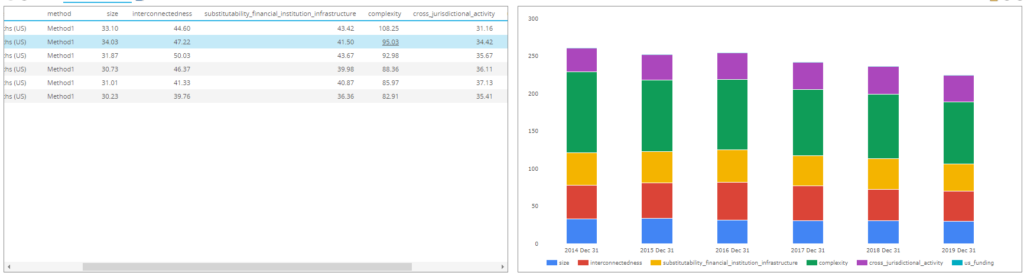
Showing:
- 3% drop in Size.
- 4% drop in Interconnectedness.
- 11% fall in Substitutability.
- 4% fall in Complexity
- 5% reduction in Cross-jurisdictional activity.
That is an impressive track record during the year, and suggests that banks are indeed actively targeting these metrics. We covered this briefly in our look at Window Dressing for the GSIB Framework following ECB research on the topic.
This year’s data suggests that there is low-hanging fruit, such as compressing derivatives notional (see JPM). However, it is also possible to go further and aim for improvements across the board (ala Goldmans).
China Construction Bank
The one institution moving higher in the GSIB scores also saw increases across the board:
- 3% increase in Size.
- 4% increase in Interconnectedness.
- 6% rise in Substitutability.
- 26% rise in Complexity!
- 8% up turn in Cross-jurisdictional activity.
Looking at that Complexity indicator shows that it was as a result of a huge increase in trading and available for sale securities:
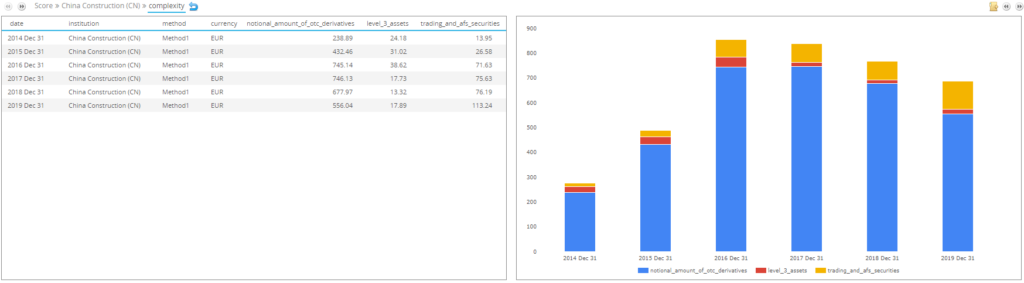
Just this brief look shows how the GSIB scores can be affected by:
- Targeted optimisation, such as JPM.
- Bank-wide targeting of all of the metrics, such as Goldman Sachs.
- Change in business mix, such as China Construction Bank that has seen a shift into trading.
Of course, it is notable that these scores can increase/decrease simply by standing still. It really matters what your peers are doing.
US Scores and Window Dressing
We noted that the US has “gold-plated” the GSIB rules and applies a stricter regime than other jurisdictions. They also provide a quarterly snapshot of the GSIB scores.
We can see that both JPM and Goldmans just manage to dip into the lower tier only at year end. Their scores immediately rebound in Q1 and Q2 2020 under their “Method 2” calculations:
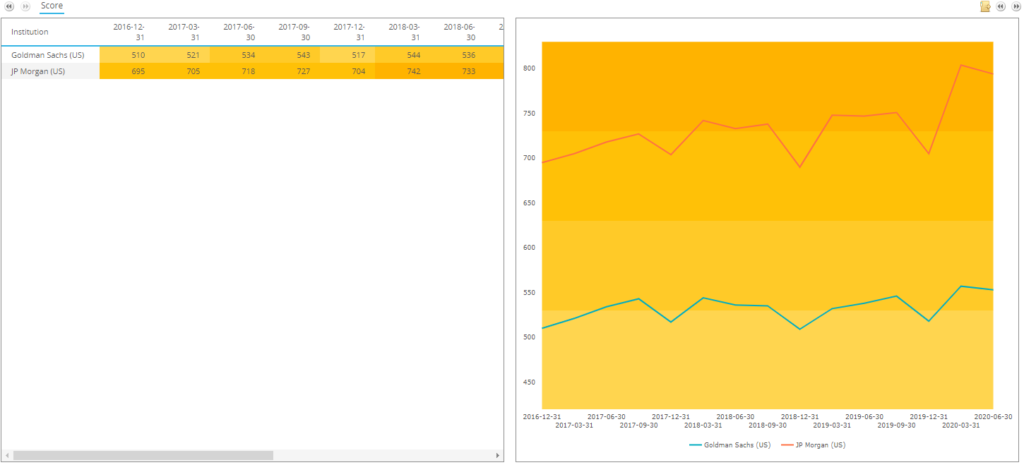
Window dressing in action! And given the time of year right now, we can expect both institutions are currently going through concerted efforts (as are the rest of the Street) to optimise these GSIB metrics into the key year-end measurement period.
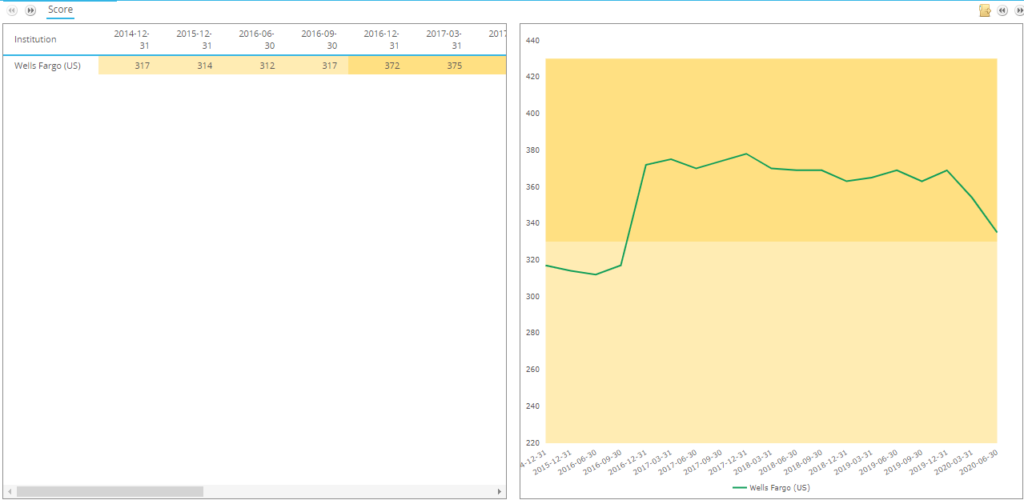
Wells Fargo
Finally, Wells Fargo is another bank who have managed to reduce every single GSIB indicator, suggesting there is a strong focus on optimising the metrics. The largest drop was in the Substitutability indicator, dropping by 13% between 2018 and 2019.
These reductions at Wells were successful under the Method1 global scores, and would have moved them to a lower bucket for capital. However, under the US-specific Method2 score, they did not change buckets this year.
Looking at the most recent quarterly filings, Wells are continuing to target these metrics. They are now very close to dropping into the lower bucket under the Method2 scores. They are on the cusp of saving 0.5% of Tier One capital (dropping from the +2% to +1.5% bucket).
In Summary
- JP Morgan were able to successfully lower their GSIB score in the Complexity indicator.
- Goldman Sachs successfully reduced all of their GSIB indicator scores.
- Both banks exhibit end-of-year window dressing behaviour, with their GSIB scores immediately rebounding in Q1 and Q2 of 2020.
- The GSIB assessment is 12-months delayed so we do not see any impact of the 2020 market turmoil on the global metrics.
- GSIBView standardises the data collection and analysis of these important metrics.