- Public disclosures from CCPs reveal the maximum variation margin (VM) called each quarter.
- In the quarter to June 2020, VM has stayed at elevated levels compared to 2019.
- VM is running about 34% higher than Q4 2019 and 66% higher than this time last year.
- Funding daily VM puts complex demands on the industry.
- Understanding these flows and providing transparency around them is important to ensure financial stability.
I was pleased to see this week that the FSB cited Clarus work in their “Holistic Review of the March Market Turmoil“, specifically our blog looking at how Variation Margin reacted in March: MARGIN CALLS DURING COVID-19.
The Chicago Fed have also just published an insightful blog looking at the potential use of buffers by CCPs to reduce cyclical funding demands:
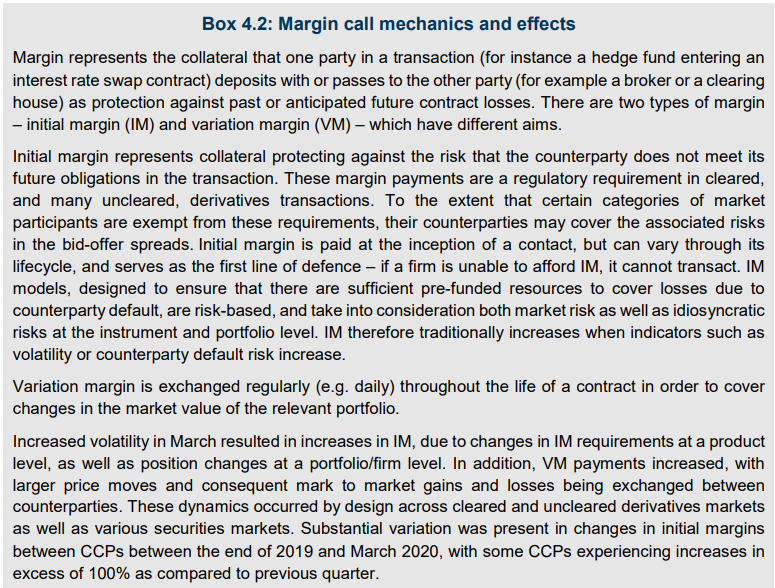
Interestingly, both of these resources go to the lengths of explaining the differences between VM and IM. I recommend Box 4.2 from the FSB if you are fresh to the Clearing game:
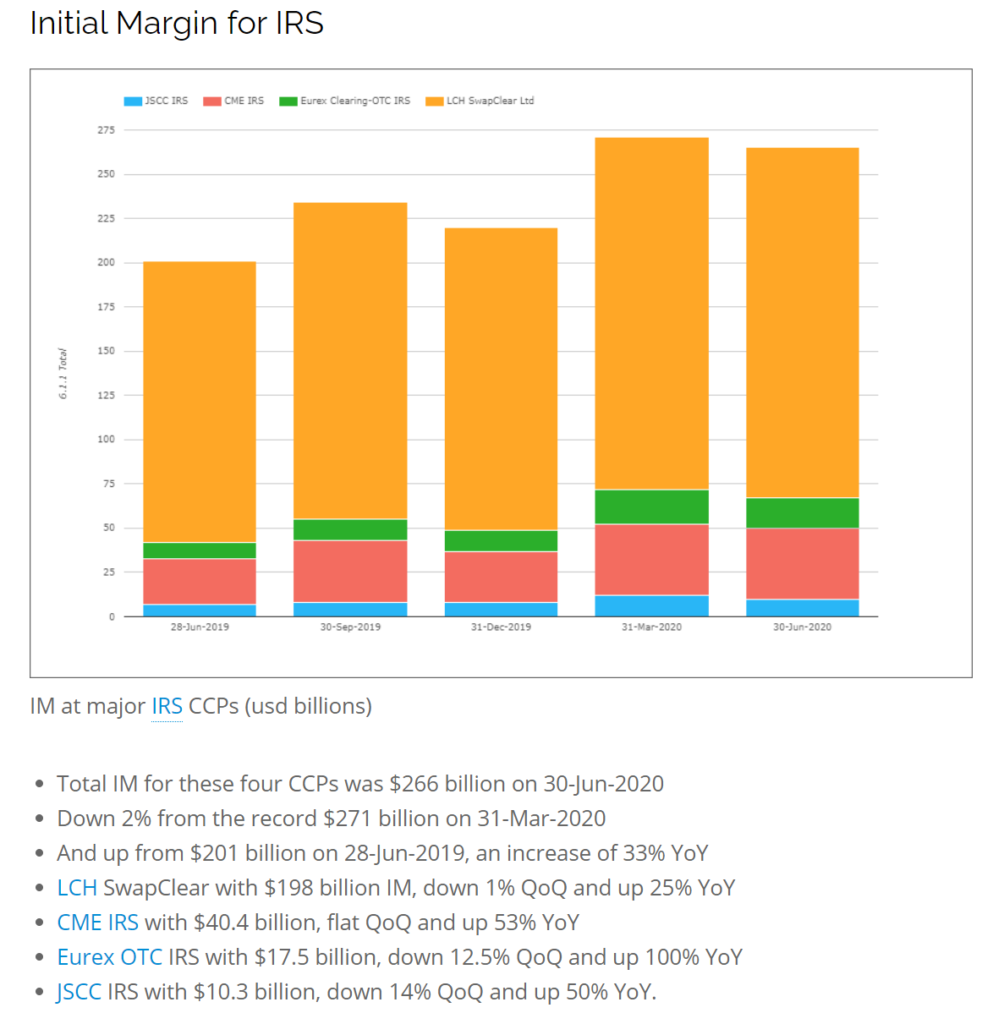
Initial Margin
Amir has already run through the IM data from the CCP Quant Disclosures for the second quarter of 2020. He found that IM had dropped only 2% from March to June and was still up by 33% YoY for IRS. Have a read of the full blog below:
Variation Margin
From the same CCP quantitative disclosures, we can also look at some Variation Margin data. The disclosures include two measures of VM:
- Disclosure 6.7.1 Maximum Total VM
- Disclosure 6.6 Average Total VM
In this blog, as per our previous look at this data, we will concentrate on 6.7.1 – the Maximum Total Variation Margin during the quarter.
Peak Variation Margin
CCPView now covers 68 clearing services across 39 CCPs. As we said earlier this year, we cannot assume that the “Maximum Total VM” during the quarter was always called on the same day across all of the Clearing Services. Adding them all together to get to a “peak funding requirement” isn’t necessarily accurate, but it is the only data that we have.
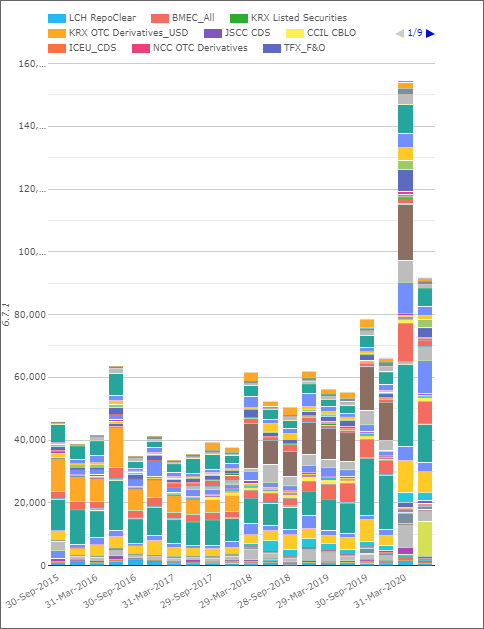
Caveats aside, the data available to us suggests that:
- Variation Margin calls remained elevated during Q2 2020, recording the second highest total in our time-series.
- This highlights that whilst Q2 was nothing like the March turmoil, volatility across all asset classes has remained elevated.
- These clearing services cover most asset classes – Equities, Commodities, FX and Rates and includes Futures, Options, OTC across both Derivatives and Cash products.
- On the plus side, Max VM has dropped by 41%, from ~$154bn to ~$92bn in the past three months.
- However, this is still 38% higher than in Q4 2019.
- And is a huge 66% higher than a year ago.
Let’s take a look at some of the Asset Classes to see where the biggest changes have come from.
Variation Margin for IRS
Looking at the largest clearing services for OTC Rates Derivatives;
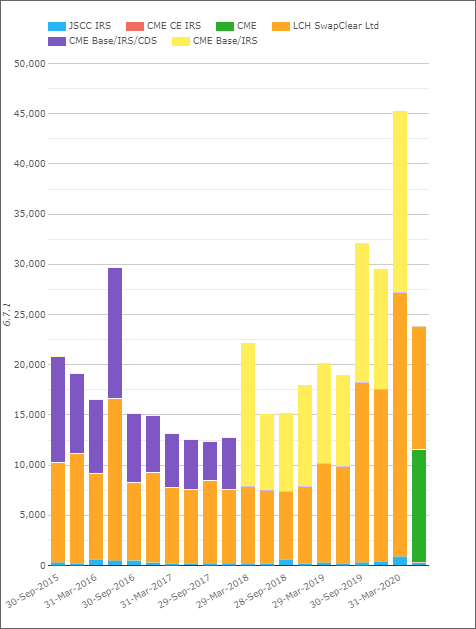
Showing;
- Peak VM calls have now dropped back below both Q42019 and Q12020 levels.
- There was a 48% reduction between March and June 2020.
- June 2020 peak VM is also 20% below Q4 2019 levels.
- However, we are 25% higher in June 2020 than last year.
- It is worth noting that these Rates clearing services accounted for 29% of the total VM in Q1 2020.
Variation Margin for ETD
For selected CCPs covering Futures (mainly Rates and FX):
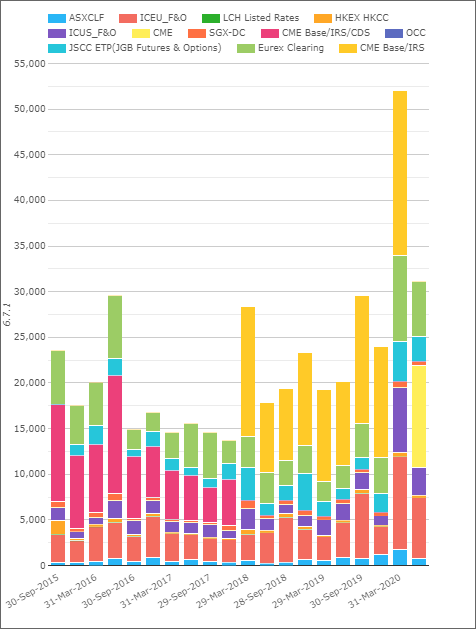
Showing;
- Peak VM calls are still higher than both Q3 and Q4 2019.
- There was a 40% reduction between March and June 2020.
- June 2020 peak VM is 30% higher than Q4 2019 levels.
- And we are 54% higher in June 2020 than last year.
- These ETD clearing services accounted for 34% of the peak VM in Q1 2020.
Variation Margin for CDS
For selected CCPs covering Credit:
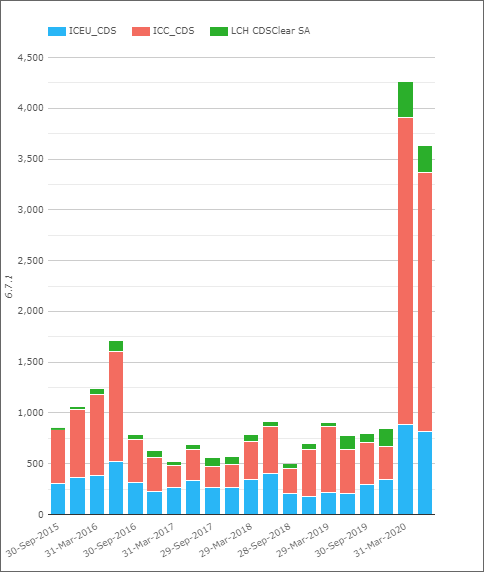
That’s a pretty serious chart!
- Peak VM calls increased by a multiple of four between Q4 2019 and Q1 2020!
- And they have largely stayed there in Q2 2020, only dropping by 15%.
- These CDS clearing services accounted for only 3% of the peak VM in Q1 2020.
Notes on the Data
This data is far from perfect in terms of trying to ascertain the precise funding impact that Variation Margin flows really have. The main limitations of the data are:
- VM is called in multiple currencies by CCPs each day. If you are long USD Rates and short EUR Rates, you will have a large aggregate margin call, but possibly a short net variation margin call each day.
- From the data there is no way to know on what date these maximum VM calls occurred.
Given the recent commentary around the funding strain that VM calls can have across the financial system, it would be extremely helpful to have:
- Better data for the cleared space. Could we imagine a daily time-series of VM in the public data, given it is already delayed by 3-6 months?
- ANY data for uncleared markets! The Uncleared Margin Rules heralded the (pretty much ubiquitous) posting of daily VM on uncleared portfolios, and yet we have close to no data (aside from the ISDA margin surveys). Could we see dealers providing some transparency into this important area, or maybe AcadiaSoft as the platform of choice? I believe the CFTC will at least get some visibility into this data as part of the Part 45 changes going on, but nothing is planned for the public realm as far as I know?
In Summary
- We need better public data from CCPs regarding Variation Margin flows.
- We need any public data regarding Variation Margin in Uncleared markets.
- From the data available, we can see that different asset classes have had very different on-going reactions to the COVID-19 pandemic.
- Credit markets have continued to see VM calls 4-5 times greater than last year.
- Whilst Rates markets, which are the biggest component of VM calls, have dropped below the levels seen last year.
- However, ETD VM amounts remain higher than last year.
- It is important to understand more about this potentially complex area.