
Q3 rates swaps volumes: new USD high, other majors off highs
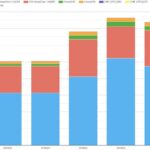
This blog covers Q3 2026 volumes of global cleared rates swaps risk-trading products focusing on OIS, fixed-float IRS, and zero-coupon swaps – including each product for a currency if it had a material volume share. We exclude FRAs (primarily used for reset exposure hedging) and basis swaps (primarily used for interest rate basis hedging). Key takeaways In Q3 […]
Q3 cross-currency volumes were 26% below Q1 while BGC, ICAP, and Tullett Prebon gained market share
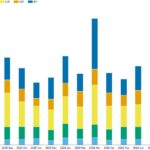
This blog reviews Q3 2026 US-reported volumes and D2D platform market shares of major currency cross-currency swaps risk-trading, continuing the quarterly series from the Q2 edition. Key takeaways In Q3 2026 major currency cross-currency basis swaps: Read on for supporting analysis of charts and data created in SDRView. Blog scope We continue to focus on US-reported […]
Q3 D2D platform rates swaps: Tullett Prebon and electronic platforms gain share
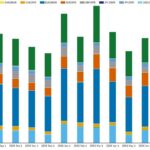
This blog reviews the Q3 2026 D2D platform market share dynamics of major currency rates swaps risk-trading, continuing from the last quarterly edition. Key takeaways We sourced the charts and statistics from SDRView. Background Here we focus on D2D platforms’ bread-and-butter trading activity in cleared OIS and fixed float IRS. We exclude compressions to keep the focus on risk-trading. […]
Large swings in Q2 FX IM optimization shares
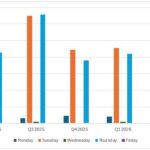
We estimate Q2 2026 FX IM optimization (IMO) hedge volumes and market share, based on US-reported daily NDF volumes sourced from SDRView. Key takeaways Q2 2026 estimates indicate that: If Capitolis can overcome its late mover disadvantage, it should expect further market share gains from LSEG (London Stock Exchange Group) and OSTTRA. Background If you […]
Record Q2 2026 CCP IM for ETD
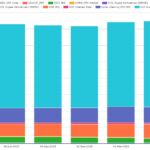
From the end of June 2026 quarterly CPMI-IOSCO Quantitative Disclosures by clearinghouses captured by CCPView, this blog focuses on cleared IM for rates swaps, credit derivatives (CRD), and exchange-traded derivatives (ETD). Key takeaways The Q2 2026 disclosures show different IM dynamics across the three product groups: IM for cleared rates swaps Chart 1: IRS IM by […]
CCP Default Management Processes and the SwapClear Fire Drill: A 2026 Update
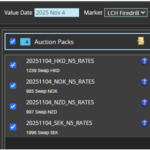
Eleven years after our extensively read original blog, how has the OTC CCP and the LCH SwapClear default management process evolved and what should clearing members be preparing for today? Why Revisit This Topic? Back in 2015, we discussed the mechanics of the SwapClear default management process (DMP) and the operational burden imposed on clearing […]
Derivatives innovation: H1 2026 Eris swap futures exceed 10% of MAC SOFR swaps
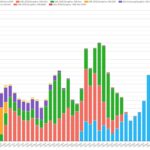
This blog shows new volume and OI peaks and tells the story of how they reached them. Key takeaways How did swap futures develop? Swap futures were created soon after the 2008 global financial crisis. This was a period of both re-regulation and experimentation driven by G20 regulators’ consensus to standardize OTC derivatives and move […]
Q2 FCM customer seg: large US banks gave up 4+% combined YoY
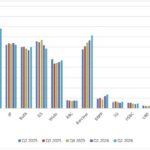
This blog looks at the market shares of customer segregated margin (customer seg) of US-regulated derivatives clearing brokers (FCMs) at the end of Q2 2026. Key takeaways At the end of Q2 2026, the biggest year-on-year (YoY) market share changes were as follows. Clearing broker market shares Derivatives client clearing brokers make most of their […]
Q2 rates compression: D2C platforms share up 5.9% YoY
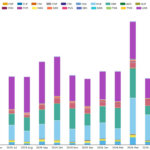
This blog is the Q2 2026 edition of our regular blog on US-reported rates swaps compression. Key takeaways Scope and data context As it was for the prior blog, our scope is US-reported compression of cleared “core” rates swaps, which we define to include OIS, fixed float IRS, and basis swaps and therefore excludes FRAs, […]
Q2 swaption volumes: BGC share down 6.1% YoY
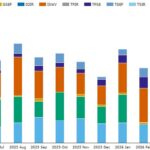
This blog reviews Q2 2026 US-reported swaption volumes and D2D platform market shares – following the Q1 edition of this series. Key takeaways After a Q1 record of $8.10 trillion, G4 currency swaptions US-reported activity returned to 2025-like levels in Q2 of $5.74 trillion “package notional” – down 5.6% year-on-year (YoY) and down 29% quarter-on-quarter […]