
This blog shows new volume and OI peaks and tells the story of how they reached them.
Key takeaways
- Swap futures’ lower cleared margin appeals to directional buy-side swap hedgers while CME portfolio margining allows swap market-makers to directly hedge buy-side swap futures with CME swaps.
- Volumes show that Eris swap futures are growing versus MAC SOFR swaps which are a growing part of USD OIS.
- By volume, Eris swap futures were 11.4% as large as MAC SOFR swaps in Q2 2026, a percentage which was 6.9% in 2024, 8.8% in 2025, and 10.6% in H1 2026.
- Combining anecdotes with volume and OI stats, I tell the story of swap futures’ development.
How did swap futures develop?
Swap futures were created soon after the 2008 global financial crisis. This was a period of both re-regulation and experimentation driven by G20 regulators’ consensus to standardize OTC derivatives and move them to electronic trading and CCP clearing.
One experiment was the trading of MAC swaps – a buy-side proposal to standardize interest rate swap economic terms to enable rates swaps to trade like bonds. The most liquid conventional interest rate swap is a spot-starting swap where the coupon is adjusted to make the PV zero. MAC swaps instead have a preset subset of whole-year maturities with IMM start and end dates and preset coupons. The coupon stays the same from one day to the next with a fee on each trade to compensate non-zero PV. Now a trading party adds or subtracts notional to or from a MAC swap “position”.
Swap futures took things one step further by making a MAC swap the underlying to a futures contract. This enabled order-driven exchange trading and lower margin through one-day SPAN futures exchange margin than the five- or seven-day VaR cleared margin typical of rates swap CCPs. Four different swap futures product variants have been tried:
- CME deliverable swap futures (DSF) deliver the underlying swap like a deliverable bond future. The delivered swap is cleared at CME and starts on the futures expiry date but is not forced to be a MAC swap.
- CME MAC swap futures are DSF with a MAC swap underlying.
- ICE swapnote futures deliver cash at expiry like a cash-settled bond future based on the value of the underlying swapnote, an unissued bond with the same cash flows as the fixed leg of a MAC swap.
- Eris swap futures deliver cash flows throughout the life of the underlying MAC swap and expire at the swap maturity rather than the swap start.
Volume history
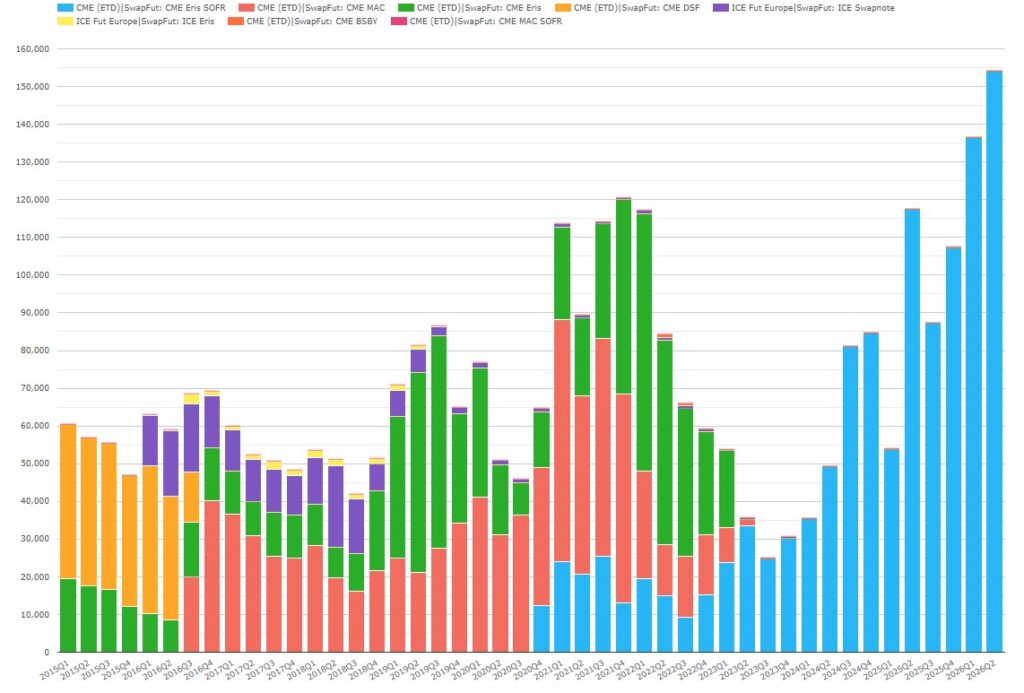
Chart 1: quarter-by-quarter swap futures volumes by product subtype (notional USD millions). Source: CCPView
Chart 1 shows swap futures volumes reaching $154.1 billion in Q2 2026 – up 31% YoY and up 28% from the Q4 2021 pre-2026 high of $121 billion. Q1 2026 also exceeded the prior high.
- CME Eris swap futures were $154.0 billion – up 31% YoY and up 31% from their Q2 2025 pre-2026 peak (including LIBOR and SOFR variants).
- ICE swapnote futures were $105 million – up 129% YoY but far below their 2021 peak of $21.6 billion.
Chart 2 also tells the story of the markets’ experiment with the four swap futures variants:
- In Q2 2010 (before CCPView started data collection), Eris launched as an independent swap futures exchange clearing at CME.
- From Q1 2015, CME DSF were in the volume majority until the Q3 2016 launch of CME’s MAC swap futures which rapidly took over from DSF.
- In Q1 2016, ICE launched EUR/GBP Eris swap futures (which eventually ceased trading in Q3 2019), and EUR swapnote futures, which peaked at $21.6 billion in Q2 2018 but fell to below $1 billion per quarter from Q1 2021.
- In Q4 2018, CME Globex executed its first Eris swap futures in December 2018, after it had licensed USD swap futures from Eris and the Eris exchange closed.
- In Q4 2020, in anticipation of participants’ need to exit LIBOR positions, Eris launched SOFR swap futures, but Eris LIBOR swap futures still grew to their all-time peak of $68.3 billion in Q1 2022.
- In Q2 2022, CME experimented with BSBY swap futures, which did not continue trading beyond Q3 the same year.
OI history
With new products, open interest (or notional outstanding) indicates collective willingness to hold positions despite the relative liquidity risk of a new product with relatively small volumes. Participants weigh the product benefits against the concern about whether and at what price they can exit positions.
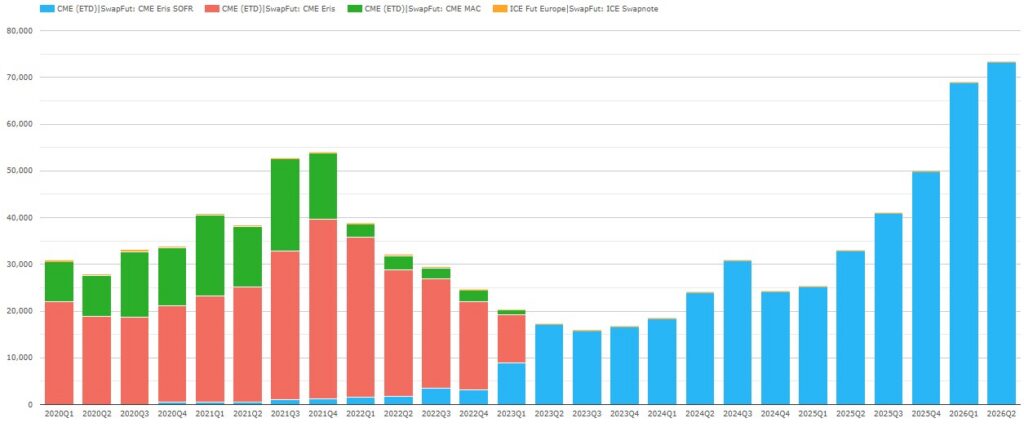
Chart 2: quarter-by-quarter swap futures open interest (OI) by product subtype (notional USD millions). Source: CCPView
Chart 2 shows that at the end of Q2 swap futures’ total OI was $73.3 billion – up 123% YoY. Both quarters in 2026 comfortably exceeded the Q4 2021 high of $54.0 billion (including Eris and MAC swap futures).
- CME Eris swap futures OI was $73.2 billion – up 123% YoY and up 85% from their 2021-end high of $39.6 billion (including both LIBOR and SOFR variants).
- MAC swap futures positions were exited in Q1 2023 as CME retired the listings before LIBOR cessation rather than supporting a conversion.
- ICE swapnote futures OI was $134 million – down 47% YoY.
Chart 2 helps to tell the specific story of the growth of Eris USD swap futures.
- REITs came on board in March 2020. During the COVID-related market dislocations that month, the REIT index dropped 44% month-on-month. Cash-strapped REITs were creative and some shifted swaps portfolios to swap futures to reduce CME IM funding costs. Other long-term directional hedgers followed suit, which led both Eris and MAC products’ OI to build up through 2021.
- LIBOR exit pressure mounted in early 2022. This led to a sudden drop in MAC LIBOR OI in early Q1 2022, while Eris LIBOR OI almost halved to $22.1 billion during 2022 with Eris SOFR only reaching $3.1 billion. Despite the early Eris SOFR swap futures launch, SOFR had not yet establish full investor comfort, leading many investors to switch from MAC LIBOR and Eris LIBOR to U.S. Treasuries instead of Eris SOFR.
- CME added Eris swap futures to portfolio margin in February 2023, allowing cross-margining of swap futures against swaps. This helped new participants used to trading CME rates swaps to try the product without grossing up CME IM. In addition, swap dealers could now directly hedge buy-side swap futures block trades with a D2D CME swap while still flattening CME IM.
- Block trading ramped up in May 2025,consistent with Q2 2025’s sharp volume increase in the chart above. When a buy-side firm block trades a product for the first time, news travels fast. Swap market-makers watch for such trades by other dealers and promote the innovation to their buy-side clients. Buy-side block trading shows investor confidence in swap futures liquidity and supports wider product adoption.
How big are swap futures really?
To compare swap futures volumes against rates futures or rates swaps would be misleading. Swap futures aim to improve the financial efficiency of trading SOFR MAC swap risk and so should be compared with SOFR MAC swaps. We can use SDRView to estimate the MAC share of USD OIS by dividing quarterly volumes of cleared USD MAC SOFR OIS by those of cleared USD OIS.
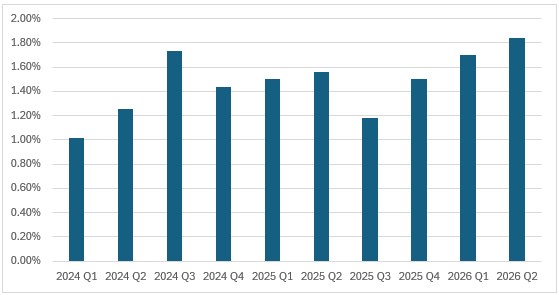
Chart 3: quarter-by-quarter MAC SOFR swaps share of USD OIS (percentage of USD notional). Source: SDRView, author analysis
Chart 3 shows a gentle upward trend in MAC SOFR swaps’ share of USD OIS, which peaked at 1.83% in Q2 2026 – up 0.28 points YoY and up 0.11 points from its Q3 2024 previous high of 1.73%.
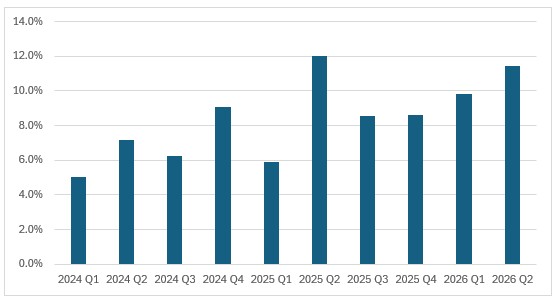
Chart 4: quarter-by-quarter Eris SOFR swap futures compared with MAC SOFR swaps (percentage of USD notional). Source: CCPView, SDRView, author analysis
Chart 4 shows that in Q2 2026 Eris swap futures were 11.4% as large in volume as MAC SOFR swaps. By year, that percentage was:
- 6.9% in 2024.
- 8.8% in 2025.
- 10.6% in 2026 to the end of Q2.
- In summary, Eris swap futures are growing versus MAC SOFR swaps, which are a growing part of USD OIS.
End note
Four charts complement the anecdotal story well.
Going forward we will cover swap futures in our regular CCP volumes and market share blogs.
- There are a lot more data and features in both CCPView and SDRView – click either link for a summary.
Skip back to the top to reread the key takeaways if you like.