- Total Initial Margin across the industry has now topped $1trn for the first time.
- Initial Margin requirements across the industry have increased by $725bn since 2016.
- This drives the need for more optimisation.
- We look at the data and benchmark the ISDA projections from way back in 2015.
Capitolis
First this week, a recommendation. No affiliation or anything, but if you only read one thing this week you should probably save my blog until later and read Matt Levine on Capitolis:
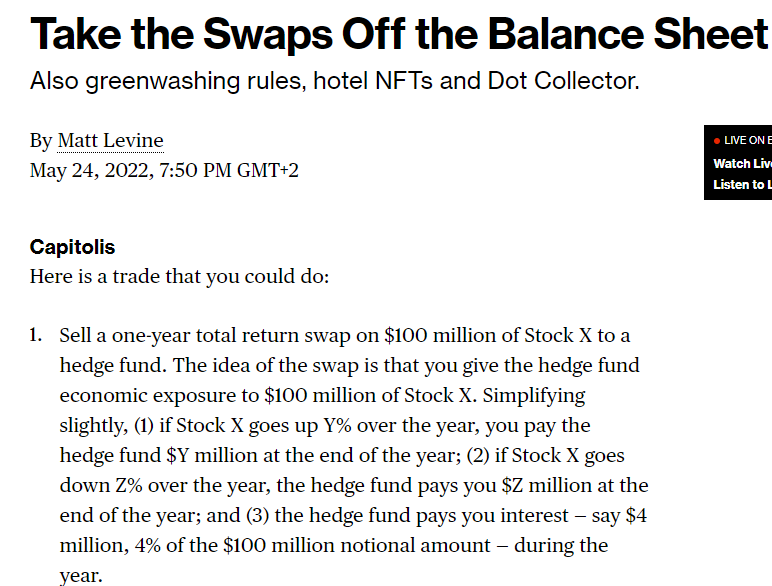
Matt Levine provides a better overview of TRS than I ever can, but you can see that we both approach these products in the same way:
The Matt Levine article touches on everything we hold dear here at Clarus, ranging from;
- Our newest data product, SBSDRView, which sheds transparency on the TRS market. The search for these Capitolis trades starts now.
- The alignment of interests between banks, looking to reduce costs, and “vendors” (Capitolis in this case) looking to facilitate these cost savings.
- The need for optimisation – whether initial margin, funding or regulatory capital.
- The move away from gross notional considerations to risk-based transfers.
- The impact of changing regulations, particularly SACCR, on the whole trade lifecycle from execution through to post-trade management.
Which brings me onto….Initial Margin
Whenever I read the annual ISDA surveys on Uncleared Margin, I always wish we had the same resource available for SACCR. Tracking what has happened to bank’s risk-based requirements under SACCR gives us a great feel for how much risk is in the system and how banks are managing it. For now, we concentrate on Margin, but we should be doing this for SACCR as well (hence the Capitolis story above).
For anyone who missed it, ISDA have published the latest edition of the “ISDA Year-End Margin Survey”:
We have covered previous versions of this survey, which are always worth a re-read because you can laugh at any predictions we made in the past 😛
- HOW MUCH MARGIN? 2019 EDITION
- ISDA MARGIN SURVEY 2018
- MARGIN FOR NON-CLEARED DERIVATIVES (2017 Margin Survey)
- HOW LARGE WILL INITIAL MARGIN BE FOR UNCLEARED SWAPS?
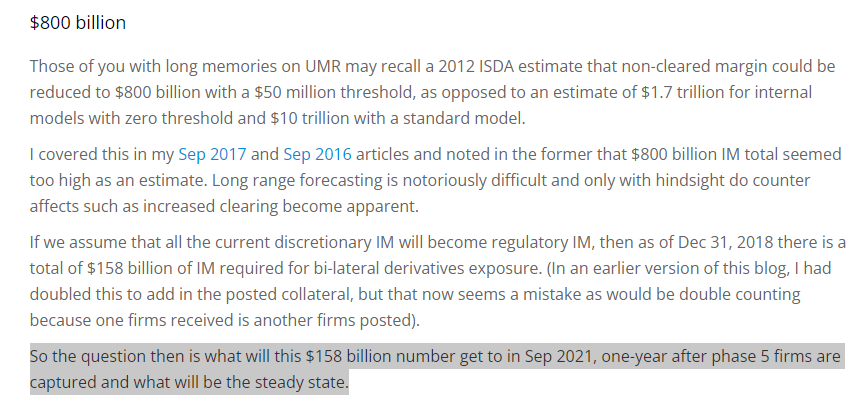
Sifting through all of those leads us to the question – how are we doing versus the “expected” $650-800bn that ISDA estimated would be consumed as a result of the Uncleared Margin Rules:
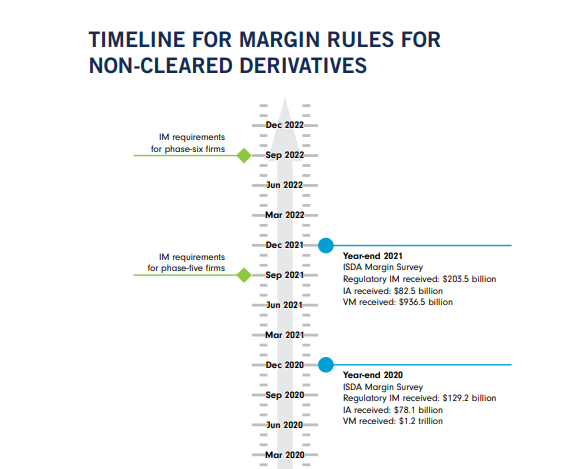
We can now benchmark against that, with Phase Five live since September 2021 according to the latest ISDA timeline:
$304 Billion
From ISDA:
The survey finds that 32 firms – including 20 phase-one entities, five of the six phase-two firms and seven of the eight phase-three firms that are subject to the margin rules – collected about $304.1 billion of IM
ISDA Margin Survey Year-End 2021
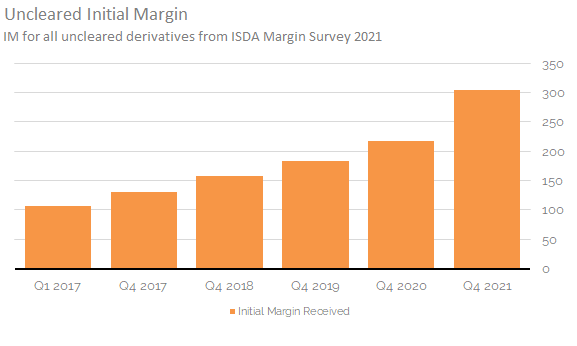
The Clarus chart above shows;
- Total Uncleared IM has now tripled, from about $100bn to $300bn between 2017 and 2021.
- The increase from 2020 to 2021 is the biggest increase on record, increasing by $86bn (+40%).
- This isn’t far off the initial increase from the Phase One firms going live.
- The big jump is due to the large increase in number of covered counterparties, with Bloomberg quoting 196 more “firms” (potentially covering more than one legal entity each) being covered as of September last year.
What Products Drive Initial Margin?
It is likely that the “RatesFX” bucket of ISDA SIMM is the single largest driver of Initial Margin. With physical FX trades (i.e. FX Forwards) exempt from the Uncleared Margin Rules, it is FX Options and NDFs that cause the pain in FX. For Rates, it is most likely Swaptions – particularly as the delta hedges are mandated to be cleared.
Something I wasn’t aware of until writing this blog is that security-based swaps in the US will not be subject to UMRs for newly eligible Phase 5 counterparties (banks are already covered I believe) – which is a bit weird:
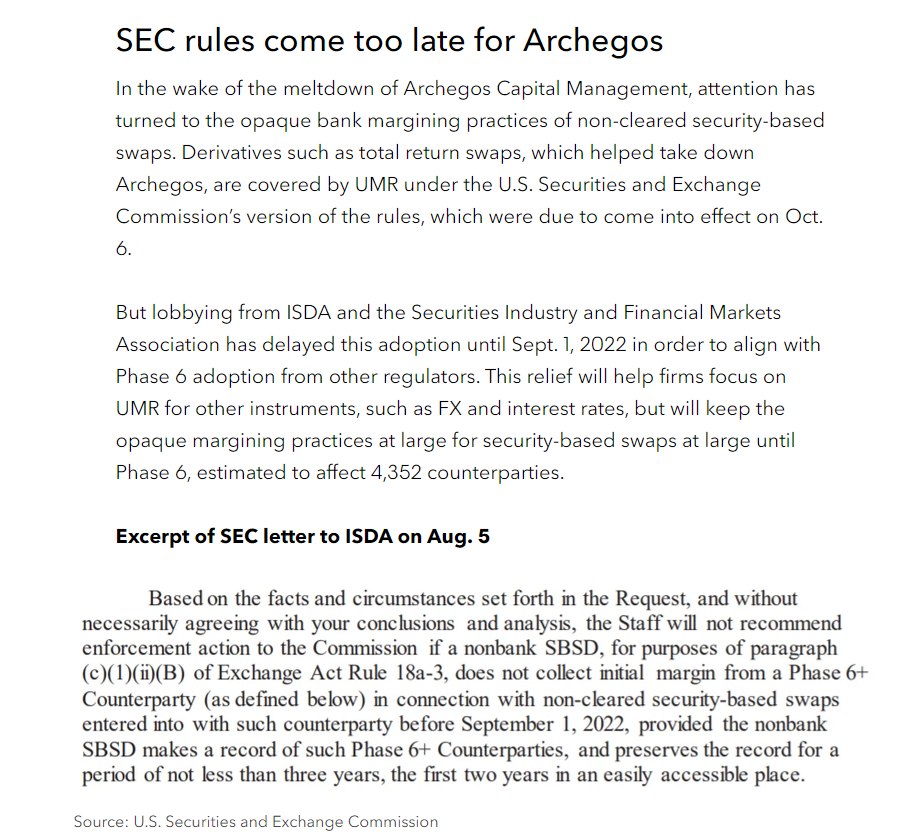
Given it is mainly hedge funds coming into scope with Phase 5, we should therefore probably expect an increase in uncleared Initial Margin next year as more products, and Phase 6 counterparties, come into scope.
From memory, ISDA SIMM does not “cross margin” across the four asset classes:
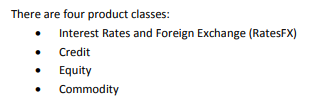
It should therefore be possible to survey firms to find out what the relative contribution of each asset class is. That would be valuable transparency in our opinion.
Total Initial Margin is now over $1Trn
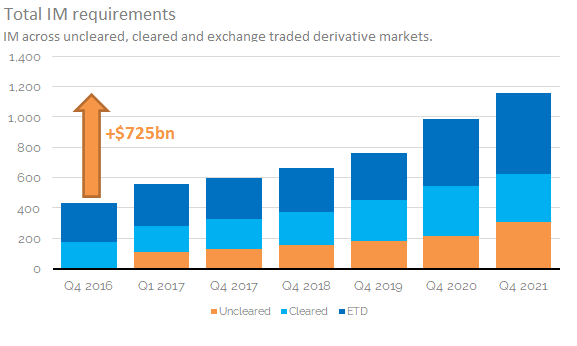
So far, we’ve witnessed a 40% increase resulting in $86bn more of uncleared margin being posted during 2021. This should be put in context with what has happened in other product areas over the same time period. How did Initial Margin change in Cleared OTC Derivatives and in Exchange Traded Derivatives (futures)? CCPView shows the following:
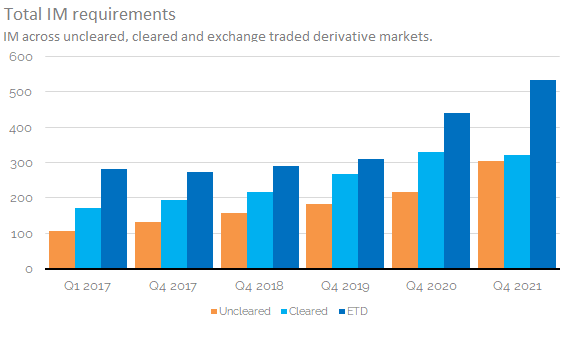
Showing;
- From 2020 to 2021, uncleared IM increased by $84bn to $304bn.
- Cleared IM decreased by $8bn to $321bn.
- ETD IM increased by $96bn to $534bn.
- Total Initial Margin has surpassed $1trn for the first time.
- The total increased from $986bn in 2020 to $1,160 in 2021, a total increase of $174bn (18%).
Putting this in context, let’s look at how the relative portion of the IM burden has evolved:
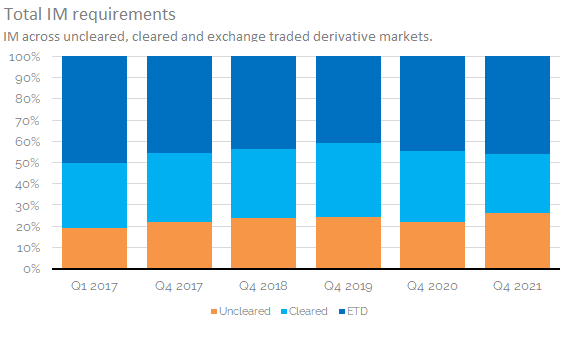
Showing;
- Uncleared IM made up 19% of the total IM burden back in 2017 when first introduced.
- This has risen to “only” 26%, despite the extra 200 firms being captured since!
- Cleared OTC accounted for 31% in 2017 and is now at 28%.
- Similarly, ETD was at 50% and has actually decreased to 46%, despite the large absolute increases we have seen in both 2020 and 2021.
It is a complex narrative to unweave. The individual risk drivers likely differ slightly between each area and are almost certainly all related:
- Uncleared IM is being mainly driven higher by more and more counterparties coming in-scope. The lack of multilateral netting hurts. Directional firms will likely need to be motivated to participate in optimisation runs.
- Cleared IM for OTC derivatives has increased by 86% over the past 4-5 years. This will likely be a consequence of more risk finding its way into clearing and out of uncleared markets. We’ve looked at this previously with the growth of cleared volumes in non-mandated products, ranging from NDFs to OIS and Inflation swaps.
- ETDs are a bit of a puzzle. More volatility, more volume, more extreme events (like margins on oil-related contracts, gas etc. all increasing significantly) all play their part. Also, more risk coming into ETDs as more counterparties are in-scope to post margin or hit concentration thresholds for cleared OTC are likely factors.
So how did we score?
As stated earlier, we looked at the ISDA estimate of “$800bn” in IM, and thought maybe $650bn was more reasonable. As highlighted above, we should not only look at the amount of Uncleared IM. This is because the Uncleared Margin Rules are as much an economic mandate to clear as they are to generate more IM in uncleared markets. What we can say is that between Q4 2016 (when there was no bilateral IM) and end of 2021 the total IM burden of the industry has indeed increased by $725bn:
In Summary
- Total Initial Margin now stands at $1,160 billion.
- This has increased by $725bn since 2016.
- It chimes remarkably well with the ISDA long-term forecasts from 7 years ago.
- All roads point to more optimisation being necessary across the industry in the coming years.